
Monitoring with Prometheus
Metrics over time.
The metrics server tells you the present. But to understand problems, you need history. Was the memory growing all week? When did the errors start? Prometheus is the standard monitoring system for Kubernetes. It collects numbers from everything, and stores them, so you can ask questions about the past. Let's install it.
- Metrics over time
- The standard for Kubernetes
- Collect, store, query, alert
How Prometheus works
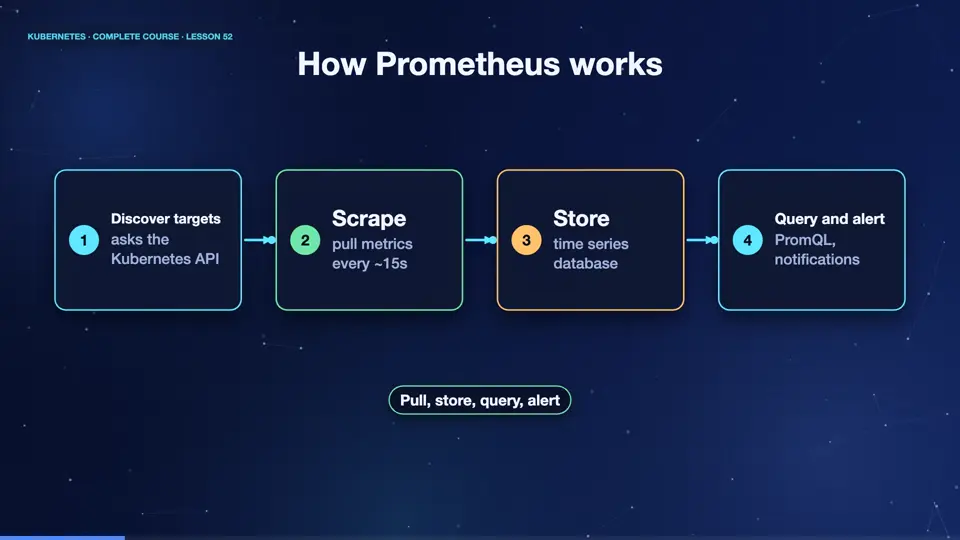
Prometheus works by pulling. Every fifteen seconds or so, it visits a list of targets, and reads their metrics page, a simple text page of numbers. It stores each number with a timestamp, in its own time series database. You ask questions, using a query language called prom Q L. And alert rules watch the numbers, and notify people when something is wrong. In Kubernetes, Prometheus finds its targets automatically, by asking the A P I server what exists.
- Discover targetsasks the Kubernetes API
- Scrapepull metrics every ~15s
- Storetime series database
- Query and alertPromQL, notifications
Installing with Helm
We install it with Helm, using a small values file, which turns off the parts we do not need. After a minute or two, a few pods are running, in their own namespace. The Prometheus server itself. Kube state metrics, which turns Kubernetes objects, like deployments, into numbers. And a node exporter, on every node, which reports the machine's own health. Three sources, all collected for us.
helm repo add prometheus-community https://prometheus-community.github.io/helm-charts
"prometheus-community" already exists with the same configuration, skipping
helm install prom prometheus-community/prometheus -n monitoring --create-namespace -f values.yaml --wait | head -5
NAME: prom
LAST DEPLOYED: Fri Oct 30 23:53:36 2026
NAMESPACE: monitoring
STATUS: deployed
REVISION: 1
kubectl get pods -n monitoring
NAME                                       READY   STATUS    RESTARTS   AGE
prom-kube-state-metrics-6c9f4b5569-qscvj   1/1     Running   0          39s
prom-prometheus-node-exporter-8l7xb        1/1     Running   0          39s
prom-prometheus-node-exporter-fr7z2        1/1     Running   0          39s
prom-prometheus-node-exporter-t8z4c        1/1     Running   0          39s
prom-prometheus-server-59c6d9cf5f-cslnj    2/2     Running   0          39s
File used: values.yaml
alertmanager:
  enabled: false
prometheus-pushgateway:
  enabled: false
server:
  persistentVolume:
    enabled: false
The Prometheus interface
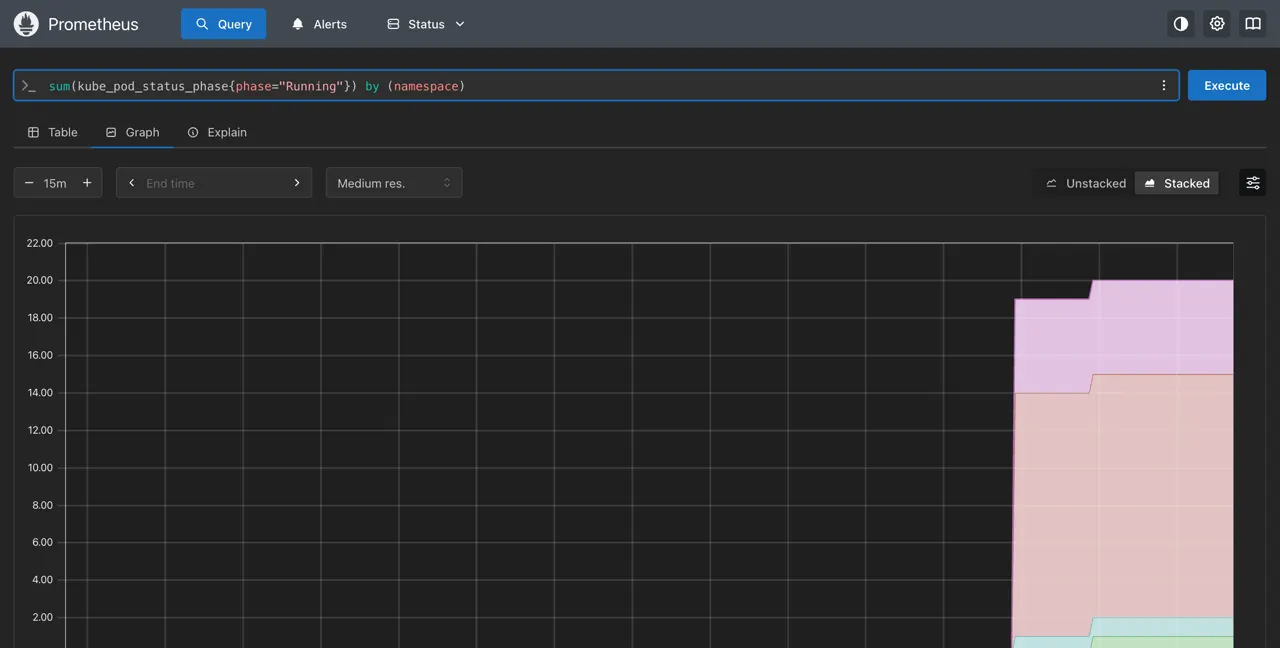
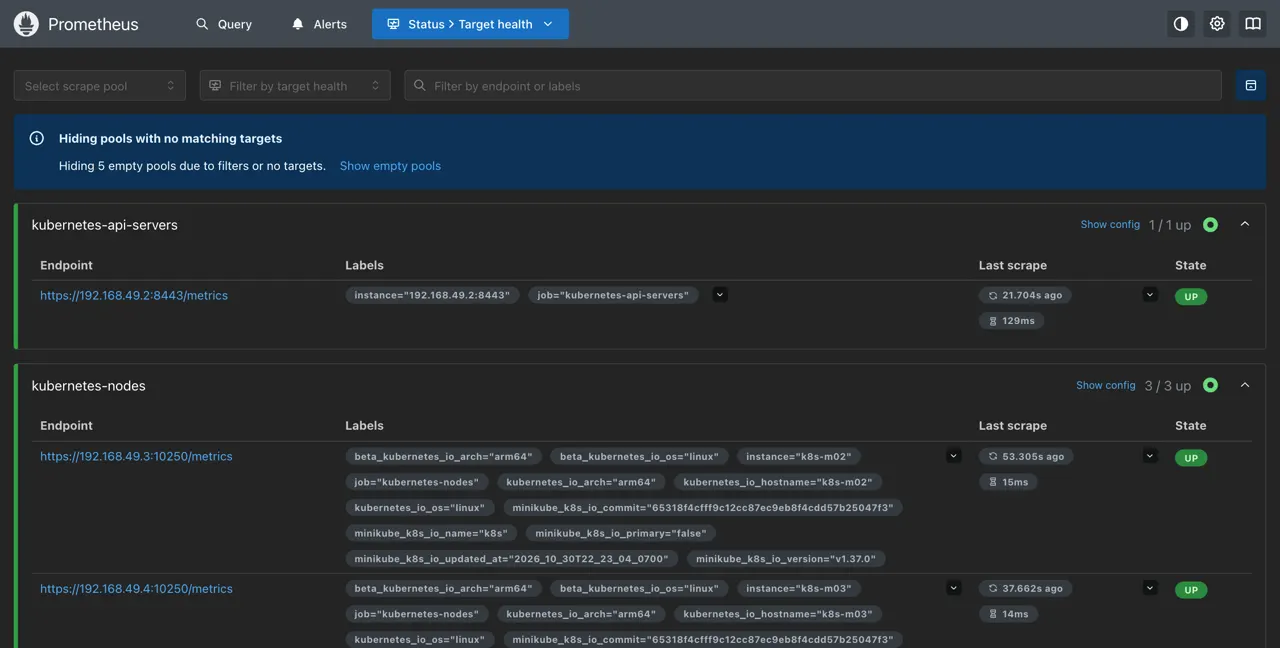
Prometheus has its own web interface. Here, we ask a question in prom Q L, the number of running pods, grouped by namespace, and draw it as a stacked graph. The coloured bands are namespaces, and the height is the pod count. Open the targets page, and you see everything Prometheus is scraping, the A P I server, every node, and more. All of them are up, with the time of their last scrape.
A few PromQL questions
You can learn prom Q L gradually. A metric name alone, shows its current value. Wrapping it in rate, and a time window, gives a per second speed. Sum, with a by clause, groups the results by a label. So, for example, sum of the rate of C P U seconds, by namespace, answers, which team is using the most processor? Start from a dashboard, then copy and adjust queries, as everyone does.
| Question | PromQL |
|---|---|
| How many pods are running? | sum(kube_pod_status_phase{phase="Running"}) |
| Which targets are up? | up |
| CPU speed per namespace | sum(rate(container_cpu_usage_seconds_total[1m])) by (namespace) |
Summary
Good. Prometheus discovers targets, scrapes metrics, stores them as time series, and answers questions with prom Q L. Kube state metrics and node exporter fill it with Kubernetes data. Next, the other half of observability, logs.
Key takeaways- Prometheus: pull and store metrics
- PromQL asks questions
- kube-state-metrics + node-exporter