
Metrics and Top
Seeing what your cluster uses.
You cannot manage what you cannot see. Autoscalers, and you, need numbers, how much C P U and memory each pod and node uses right now. The component that provides them is the metrics server. In this lesson, you will use it, and learn what it can and cannot do.
- Numbers power autoscaling
- Metrics server collects them
- kubectl top shows them to you
Where the numbers come from
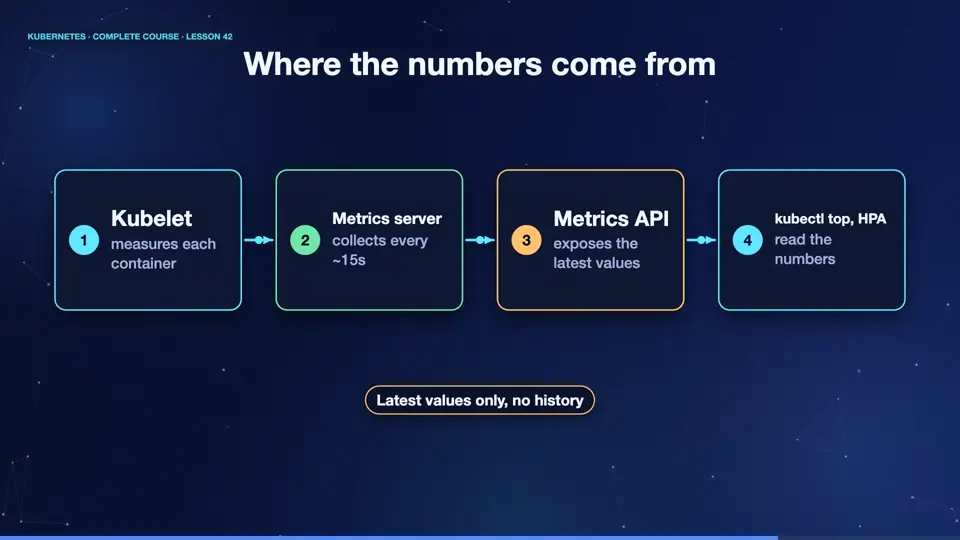
Here is the path of a measurement. On every node, the kubelet knows how much each container uses. The metrics server asks every kubelet, every fifteen seconds or so, and keeps the latest values in memory. It exposes them through the Kubernetes A P I. Then, kube control top, the dashboards, and the autoscalers, read from that A P I. Notice, it only keeps recent values, it is not a history database. For history, you need a monitoring system, which we cover soon.
- Kubeletmeasures each container
- Metrics servercollects every ~15s
- Metrics APIexposes the latest values
- kubectl top, HPAread the numbers
kubectl top
Let's use it. Top nodes shows the C P U and memory of each machine, as a number, and as a percentage. Top pods shows the same for pods. Here, we look at the system pods, and see which ones use the most. You can also sort them. This is the first thing to check, when an app is slow, or a node feels crowded.
kubectl top nodes
NAME      CPU(cores)   CPU(%)   MEMORY(bytes)   MEMORY(%)
k8s       133m         1%       1143Mi          10%
k8s-m02   165m         2%       455Mi           4%
k8s-m03   74m          0%       509Mi           4%
kubectl top pods -n kube-system --sort-by=memory | head -6
NAME                              CPU(cores)   MEMORY(bytes)
kube-apiserver-k8s                25m          263Mi
etcd-k8s                          12m          83Mi
kube-controller-manager-k8s       9m           69Mi
kube-scheduler-k8s                5m           28Mi
metrics-server-85b7d694d7-x54lc   2m           23Mi
kubectl top pods -n kube-system --sort-by=cpu | head -4
NAME                              CPU(cores)   MEMORY(bytes)
kube-apiserver-k8s                25m          263Mi
etcd-k8s                          12m          83Mi
kube-controller-manager-k8s       9m           69Mi
Metrics versus monitoring
Remember the difference. The metrics server is small, and gives you the present moment, perfect for top, and for autoscaling. A monitoring system like Prometheus, stores metrics for weeks, lets you draw graphs, and send alerts, when something goes wrong. Most production clusters have both. In a later clip, we will build the monitoring side, and look at logs and events as well.
Summary
Wonderful. The metrics server gives the latest C P U and memory, and kube control top shows them. Autoscalers use the same data. With scaling covered, it is time for a vital subject, security, starting with who is allowed to do what.
Key takeaways- metrics-server feeds top and HPA
- Only the latest values
- Prometheus keeps the history