
Lab: The Silent Service
Healthy, yet unreachable.
The third lab. Everything looks fine. The pods are running and ready, the service exists, and has endpoints. Yet every request fails. These problems drive people mad, until they learn where to look. The answer is nearly always, in the ports. Let's find it.
- Pods ready, service exists
- Requests still fail
- Look at the ports
The two ports
Here is the application. A deployment of an echo server, which listens on port five six seven eight. And a service in front of it. Look at the service ports. The port, eighty, is where the service listens. The target port is where the traffic is sent, inside the pod. It says, eighty. But our container listens on five six seven eight. Spot the mismatch? Let's pretend we have not, and debug it like a mystery.
apiVersion: apps/v1
kind: Deployment
metadata:
  name: api
spec:
  replicas: 2
  selector:
    matchLabels:
      app: api
  template:
    metadata:
      labels:
        app: api
    spec:
      containers:
      - name: api
        image: hashicorp/http-echo:1.0
        args: ["-text=api says hello"]
        ports:
        - containerPort: 5678
---
apiVersion: v1
kind: Service
metadata:
  name: api
spec:
  selector:
    app: api
  ports:
  - port: 80
    targetPort: 80
From symptom to fix
First, the symptoms. The pods are running, ready, and the service has endpoints, so the selector is fine. Now we test from inside the cluster, with a client pod. The request fails. The connection is refused, or hangs. That points at the port. Describe the service, and read the target port, eighty. Describe the pod, and read the container port, five six seven eight. They differ. We fix the service, with a patch, to send traffic to port five six seven eight. And we test again. This time the answer arrives. The whole lab was one number.
kubectl apply -f api.yaml
deployment.apps/api created
service/api created
kubectl get pods,svc -l app=api
NAME                      READY   STATUS    RESTARTS   AGE
pod/api-85b86ff54-6lr9k   1/1     Running   0          14s
pod/api-85b86ff54-vplcl   1/1     Running   0          14s
kubectl exec client -- wget -qO- -T 3 http://api 2>&1 | head -2
wget: can't connect to remote host (10.105.237.181): Connection refused
command terminated with exit code 1
kubectl describe svc api | grep -E 'TargetPort|Endpoints'
TargetPort:               80/TCP
Endpoints:                10.244.2.17:80,10.244.1.21:80
kubectl patch service api --type=json -p='[{"op":"replace","path":"/spec/ports/0/targetPort","value":5678}]'
service/api patched
kubectl exec client -- wget -qO- -T 3 http://api 2>&1 | head -2
api says hello
File used: api.yaml
apiVersion: apps/v1
kind: Deployment
metadata:
  name: api
spec:
  replicas: 2
  selector:
    matchLabels:
      app: api
  template:
    metadata:
      labels:
        app: api
    spec:
      containers:
      - name: api
        image: hashicorp/http-echo:1.0
        args: ["-text=api says hello"]
        ports:
        - containerPort: 5678
---
apiVersion: v1
kind: Service
metadata:
  name: api
spec:
  selector:
    app: api
  ports:
  - port: 80
targetPort: 80The debugging ladder
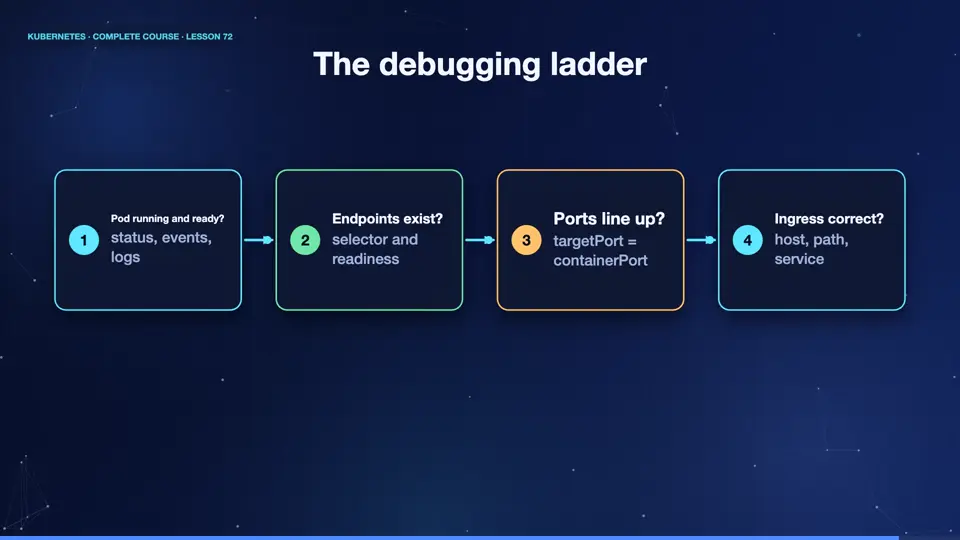
Let's summarise the three labs as a ladder. Is the pod running, and ready? If not, read the status, the events, and the logs. Does the service have endpoints? If not, check the selector, and the readiness. Do the ports line up, the service's target port, and the container port? Does the name resolve? And, only after all that, is the ingress, or the load balancer, pointing at the right place? Climb one rung at a time, and test each rung. The broken rung is the cause.
- Pod running and ready?status, events, logs
- Endpoints exist?selector and readiness
- Ports line up?targetPort = containerPort
- Ingress correct?host, path, service
Summary
Excellent. Three labs, three faults. An image tag, a probe path, a node label, and a port number. Each one was found by reading the status, the events, and the configuration, in order. Keep practising on broken things. Next, we look under the hood, at the Kubernetes A P I itself.
Key takeaways- Mismatched ports are classic
- Test from inside the cluster
- Climb the debugging ladder