
Forecasting Operations
Testing predictions about time.
Forecasts predict numbers over time, like sales next week, or server load tomorrow. They are everywhere in business, and they follow special rules. You cannot shuffle time, and you must always compare against simple baselines. In this lesson, you will evaluate a forecast the honest way, with a backtest.
- Predicting numbers over time
- Never shuffle time
- Always beat a simple baseline
Backtesting, step by step
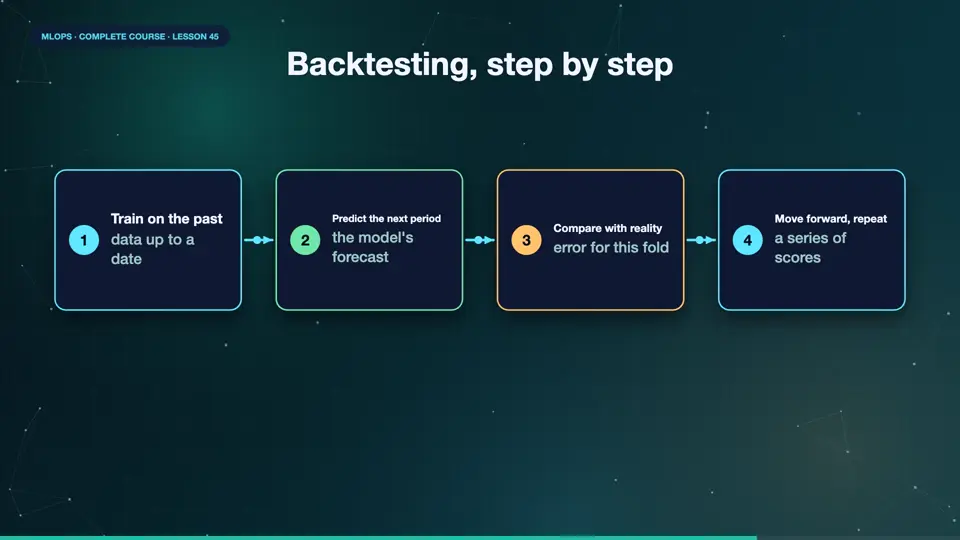
A backtest imitates the real use of a forecast, many times in the past. Train on the data up to a date, then predict the next period, and compare with what really happened. Then move the date forward, train again with more data, and predict again. Repeat. The result is not one score, but a series of scores, which shows how stable the model is. Never split the data randomly, because that lets the model see the future. Always split by time.
- Train on the pastdata up to a date
- Predict the next periodthe model's forecast
- Compare with realityerror for this fold
- Move forward, repeata series of scores
A backtest with a baseline
Here is a backtest in code. We build daily sales, with a weekly pattern, and a slow upward trend. We create features, yesterday's sales, the sales a week ago, and the day of the week. Then a time series splitter makes four folds, each one training on the past, and testing on the future. For every fold, we train a simple model, and compute its average error. Next to it, we compute the error of a naive baseline, which just repeats last week's value. The model beats the baseline in every fold, though only slightly. That is an honest result, and a reminder that simple baselines are hard to beat.
import numpy as np
import pandas as pd
from sklearn.linear_model import Ridge
from sklearn.metrics import mean_absolute_error
from sklearn.model_selection import TimeSeriesSplit

rng = np.random.default_rng(0)
days = pd.date_range("2025-01-01", periods=400)
sales = 100 + 0.1 * np.arange(400) + 15 * np.sin(2 * np.pi * np.arange(400) / 7) + rng.normal(0, 4, 400)
df = pd.DataFrame({"sales": sales}, index=days)

df["lag_1"] = df["sales"].shift(1)
df["lag_7"] = df["sales"].shift(7)
df["day_of_week"] = df.index.day_of_week
df = df.dropna()
X, y = df[["lag_1", "lag_7", "day_of_week"]], df["sales"]

print("fold  model MAE   'same as last week' MAE")
for fold, (train_idx, test_idx) in enumerate(TimeSeriesSplit(n_splits=4).split(X), 1):
    model = Ridge().fit(X.iloc[train_idx], y.iloc[train_idx])
    model_error = mean_absolute_error(y.iloc[test_idx], model.predict(X.iloc[test_idx]))
    naive_error = mean_absolute_error(y.iloc[test_idx], X.iloc[test_idx]["lag_7"])
print(f"{fold:>4} {model_error:9.2f} {naive_error:9.2f}")fold model MAE 'same as last week' MAE 1 4.31 4.58 2 4.62 4.84 3 4.56 4.78 4 4.05 4.18
Operating forecasts
Forecasts have their own operational habits. Track the error per horizon, because the next day is easier than the next month. Monitor bias, are you consistently too high, or too low. Retrain regularly, since patterns shift. Handle holidays, and promotions, as features, not as surprises. And report uncertainty, a range, not only a single number, because decisions depend on how wrong the forecast might be. A forecast without a range, is a promise nobody can keep.
Summary
Wonderful. Backtests split by time, repeat many times, and always compare with a naive baseline. Operate forecasts by tracking error per horizon, bias, and uncertainty. Next, keeping the whole system reliable, with service level objectives, and incident response.
Key takeaways- Split by time, many folds
- Beat the naive baseline
- Report ranges, track bias