
Experiment Tracking
Never lose a result again.
Training a model is a series of experiments. Different algorithms, different settings, different data. After a week, you have dozens of results, and no idea which one was the best, or how you got it. Experiment tracking fixes this. In this lesson, we use M L flow, the most popular tool for it.
- Dozens of experiments pile up
- Which one was the best?
- Record everything, automatically
Spreadsheet chaos versus tracking
Without tracking, people use file names, like model final, final two, really final. Or a spreadsheet, filled in by hand, and often forgotten. Months later, nobody can reproduce the best result. With an experiment tracker, every run is recorded automatically. The settings, the scores, the code version, the data version, and the model file. You can search, compare, and sort all runs, and return to any of them. It is a lab notebook, that writes itself.
Without tracking
- Names like final_v2_really
- Hand-filled spreadsheets
- Results cannot be reproduced
- Best model is a mystery
With tracking
- Every run recorded automatically
- Search, sort, compare
- Any run can be reproduced
- Best model is one click away
Tracking runs with MLflow
Here is experiment tracking in code, with M L flow. We name an experiment, and prepare the data. Then a helper function runs one experiment. Inside it, start run opens a record. We log the settings, called parameters. We train the model, and log the results, called metrics, here, accuracy and F one. Finally, we run three experiments, a simple model, a small forest, and a big forest. Each prints its accuracy, but, more importantly, each one is recorded.
import sys
import mlflow
from sklearn.ensemble import RandomForestClassifier
from sklearn.linear_model import LogisticRegression
from sklearn.metrics import accuracy_score, f1_score
from churn import make_data

mlflow.set_experiment("churn")
df = make_data(3000, seed=1)
X, y = df.drop(columns="churn"), df["churn"]
split = 2200
Xtr, Xte, ytr, yte = X[:split], X[split:], y[:split], y[split:]

def run(name, model, params):
    with mlflow.start_run(run_name=name):
        mlflow.log_params(params)
        model.fit(Xtr, ytr)
        pred = model.predict(Xte)
        mlflow.log_metric("accuracy", accuracy_score(yte, pred))
        mlflow.log_metric("f1", f1_score(yte, pred))
        print(name, "accuracy", round(accuracy_score(yte, pred), 3))

run("logreg", LogisticRegression(max_iter=500), {"model": "logreg", "C": 1.0})
run("forest-small", RandomForestClassifier(n_estimators=20, max_depth=3, random_state=0), {"model": "forest", "n_estimators": 20, "max_depth": 3})
run("forest-big", RandomForestClassifier(n_estimators=200, max_depth=8, random_state=0), {"model": "forest", "n_estimators": 200, "max_depth": 8})logreg accuracy 0.863 forest-small accuracy 0.851 forest-big accuracy 0.843
Also uses churn.py
import numpy as np, pandas as pd

def make_data(n, seed, shifted=False):
    rng = np.random.default_rng(seed)
    tenure = rng.integers(1, 72, n)
    charges = rng.normal(65 + (28 if shifted else 0), 18, n).clip(20, 140).round(2)
    calls = rng.poisson(1.5 + (1.5 if shifted else 0), n)
    contract = rng.choice([0, 1, 2], n, p=[.55, .25, .20] if not shifted else [.30, .30, .40])
    logit = -1.0 - 0.04 * tenure + 0.025 * (charges - 65) + 0.45 * calls - 0.8 * contract
    if shifted:
        logit = -0.2 - 0.01 * tenure - 0.01 * (charges - 65) + 0.2 * calls - 0.2 * contract
    churn = (rng.random(n) < 1 / (1 + np.exp(-logit))).astype(int)
    return pd.DataFrame({"tenure": tenure, "charges": charges, "calls": calls, "contract": contract, "churn": churn})
The MLflow interface
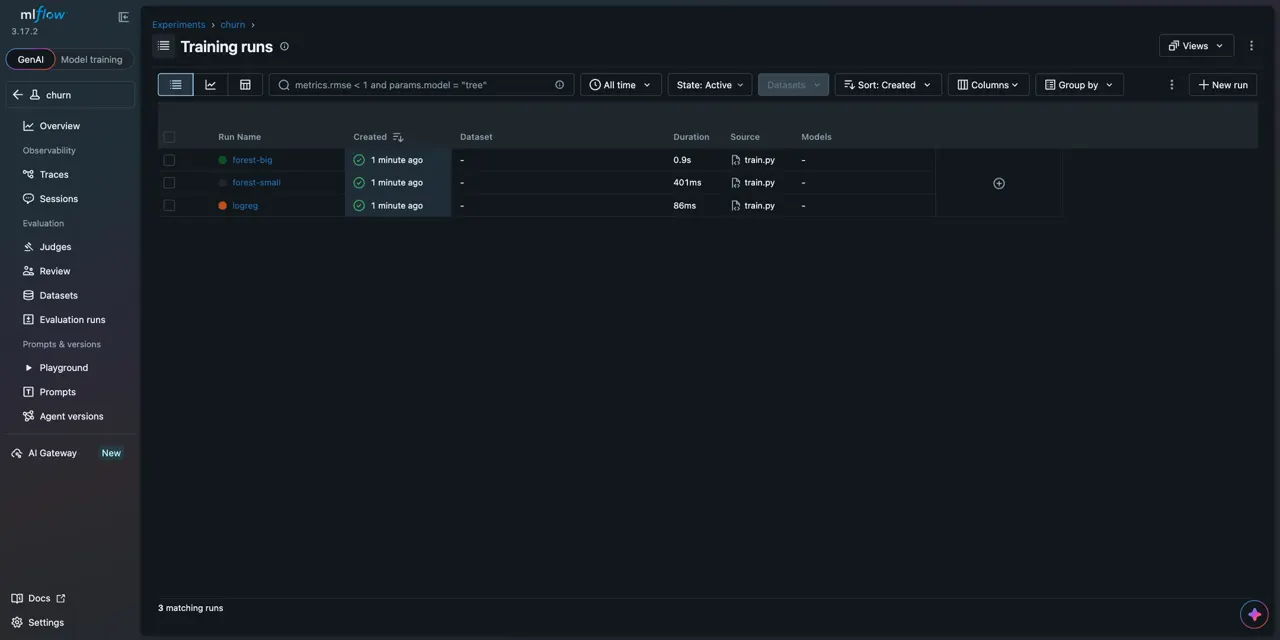
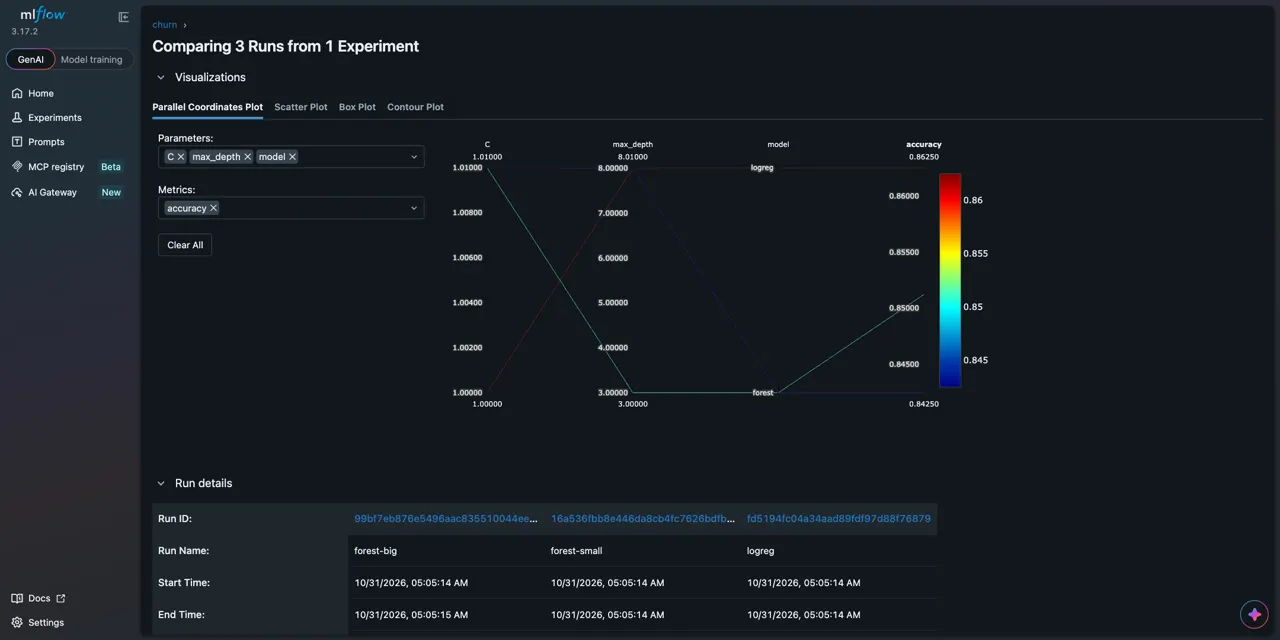
And this is the other half. M L flow has a web interface, that shows all the runs. Here are our three runs, with their names, and how long each took. We can select them, and compare. This view puts the settings, and the results, of all three runs side by side, with a plot, that connects each setting to the accuracy. Instead of guessing, we can see which combination worked best.
What to record
What should you record in every run? The parameters, every setting that can change the result. The metrics, scores on validation data, and training time. The data version, the exact fingerprint from D V C. The code version, the Git commit. The environment, library versions. And the artifacts, the model file, and any plots. If you record these six things, any past result can be rebuilt, and explained.
Summary
Excellent. An experiment tracker records parameters, metrics, versions, and artifacts for every run, so results are searchable, comparable, and reproducible. Next, the deeper question, what does reproducible really mean, and how do we guarantee it?
Key takeaways- Log parameters, metrics, artifacts
- Compare runs side by side
- Link runs to data and code versions