Pairplot is used to plot the pairwise relationships in the dataset. You can draw a pair plot in Seaborn with the following code. Seaborn provides sns.pairplot() method for pair plot. I highly recommend the “Python Crash Course Book” to learn Python. In this article, you’ll see the six different examples to draw a Seaborn pair plot.
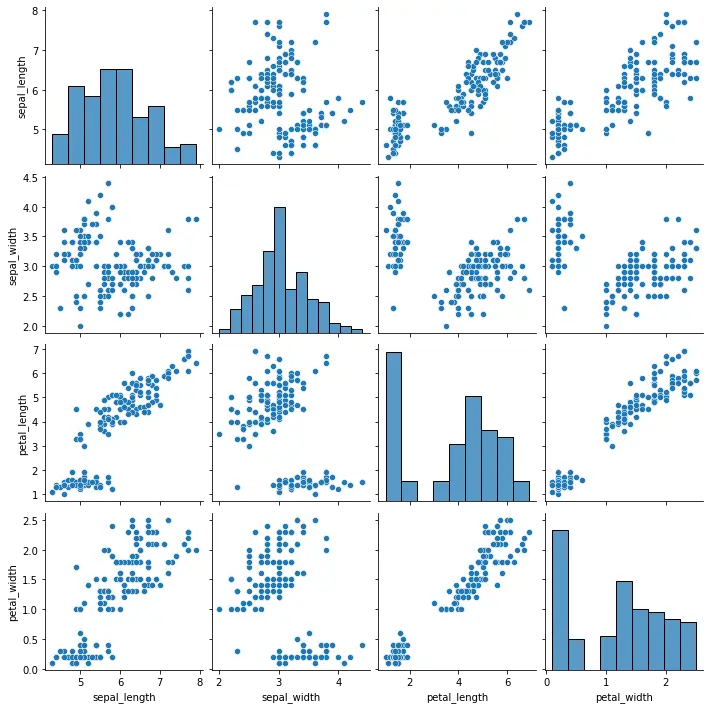
Example 1: Seaborn pairplot
# Import the required libraries
import seaborn as sns
import matplotlib.pyplot as plt

# Load the Dataset
dataset = sns.load_dataset("iris")

# Draw Pair Plot
sns.pairplot(dataset)

# Display the pairplot
plt.show()
Output:
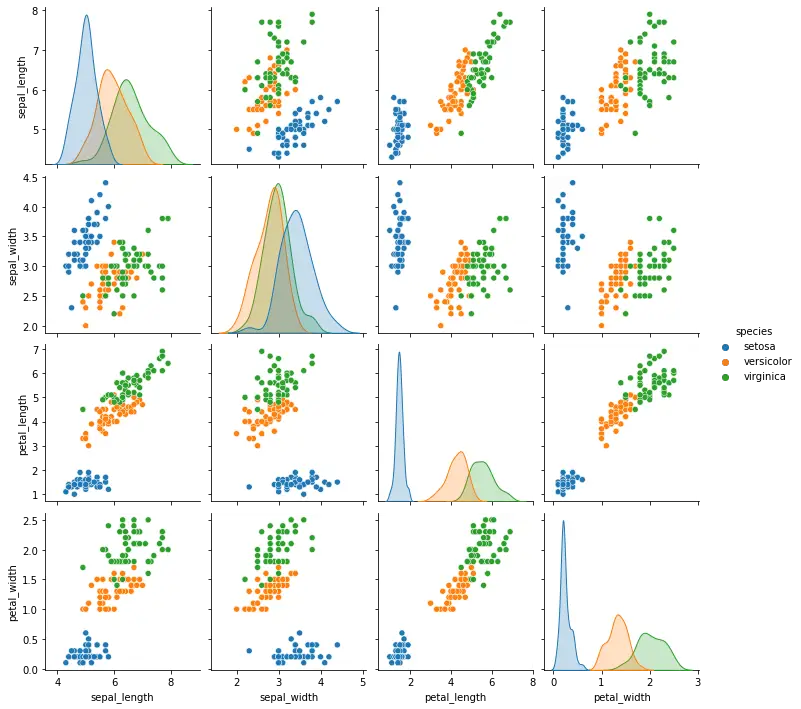
Example 2: Seaborn pairplot hue
# Import the required libraries
import seaborn as sns
import matplotlib.pyplot as plt

# Load the Dataset
dataset = sns.load_dataset("iris")

# Draw Pair Plot
sns.pairplot(dataset, hue="species")

# Display the pairplot
plt.show()
Output:
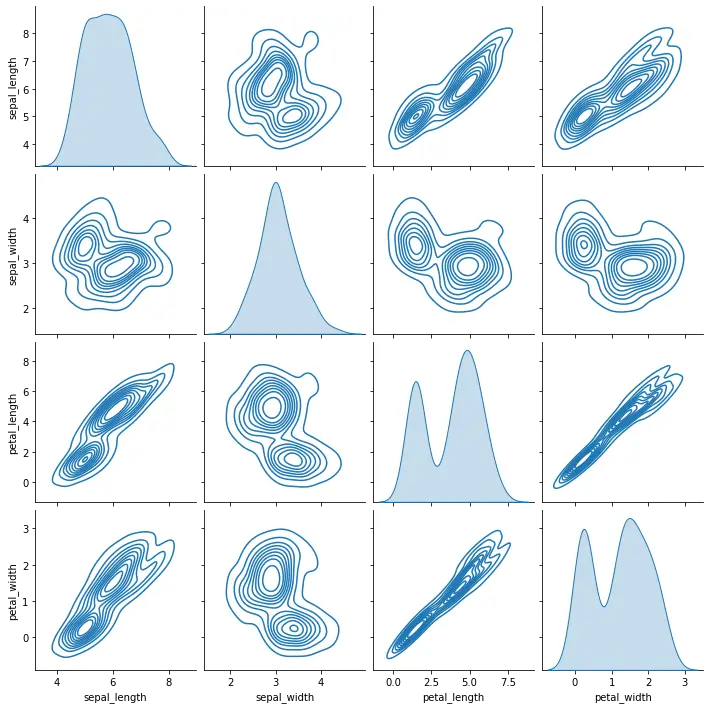
Example 3: Seaborn pairplot KDE (Kernel Density Estimate)
# Import the required libraries
import seaborn as sns
import matplotlib.pyplot as plt

# Load the Dataset
dataset = sns.load_dataset("iris")

# Draw Pair Plot
sns.pairplot(dataset, kind="kde")

# Display the pairplot
plt.show()
Output:
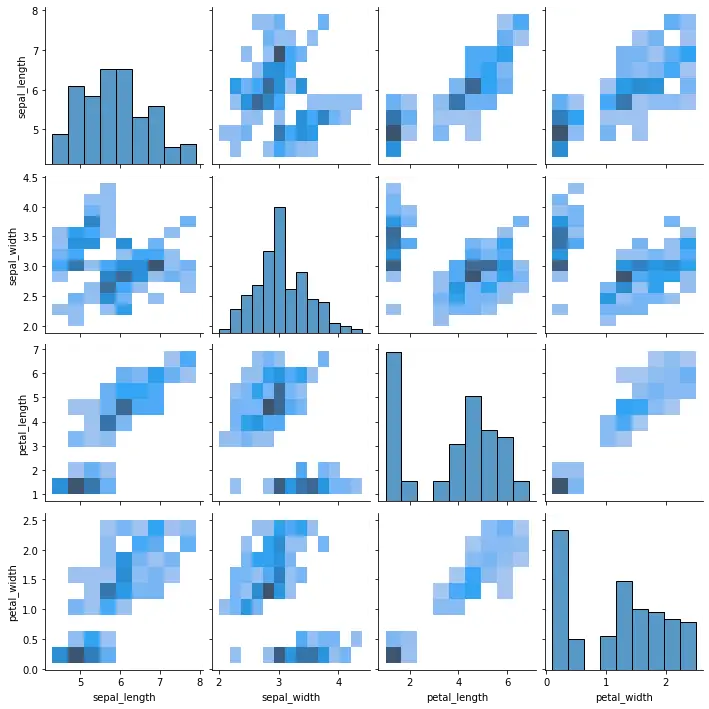
Example 4: Seaborn pairplot histogram
# Import the required libraries
import seaborn as sns
import matplotlib.pyplot as plt

# Load the Dataset
dataset = sns.load_dataset("iris")

# Draw Pair Plot
sns.pairplot(dataset, kind="hist")

# Display the pairplot
plt.show()
Output:
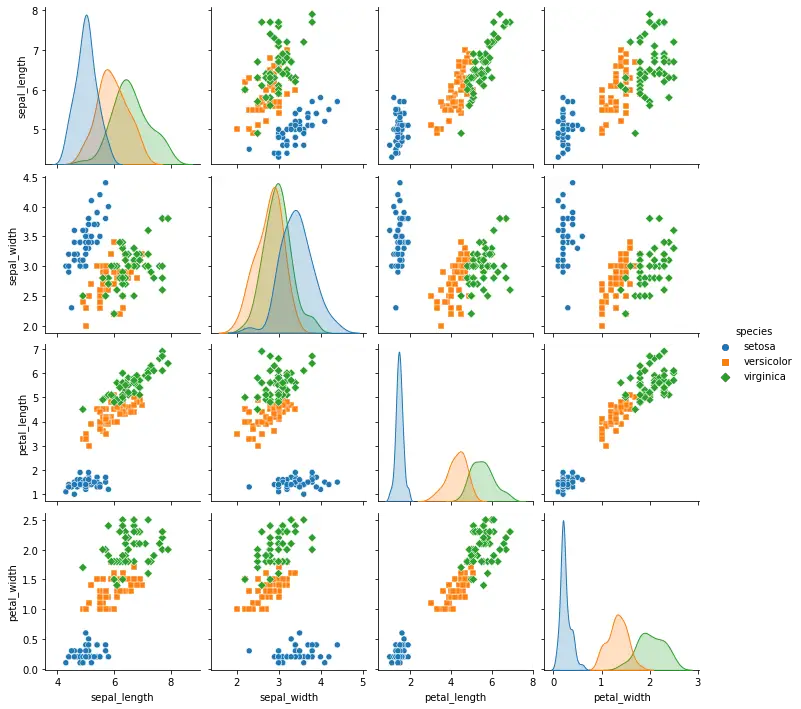
Example 5: Seaborn pairplot markers
# Import the required libraries
import seaborn as sns
import matplotlib.pyplot as plt

# Load the Dataset
dataset = sns.load_dataset("iris")

# Draw Pair Plot
sns.pairplot(dataset, hue="species", markers=["o", "s", "D"])

# Display the pairplot
plt.show()
Output:
Example 6: Seaborn pairplot size
# Import the required libraries
import seaborn as sns
import matplotlib.pyplot as plt
# Load the Dataset
dataset = sns.load_dataset("iris")
# Draw Pair Plot
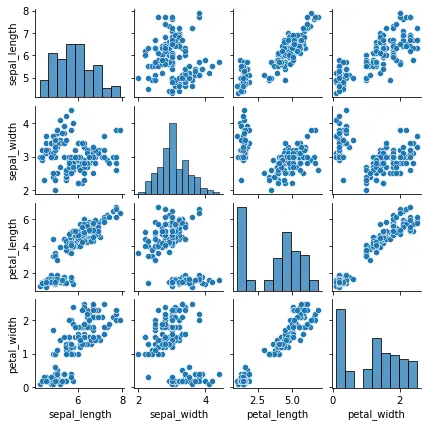
sns.pairplot(dataset, height=1.5)
# Display the pairplot
plt.show()Output: