You can plot a histogram in Seaborn with the following code. In this article, you will see histograms with different parameters. I highly recommend you “Python Crash Course Book” to learn Python.
I will use the iris dataset in these examples. The iris dataset is built-in in the Seaborn library. First, I will load and display the first five rows of the iris dataset.
# Import the Seaborn library as sns
import seaborn as sns

# Load the iris Dataset
iris = sns.load_dataset("iris")

# Display first five rows
print(iris.head())
sepal_length sepal_width petal_length petal_width species 0 5.1 3.5 1.4 0.2 setosa 1 4.9 3.0 1.4 0.2 setosa 2 4.7 3.2 1.3 0.2 setosa 3 4.6 3.1 1.5 0.2 setosa 4 5.0 3.6 1.4 0.2 setosa
Example 1: Plot Histogram Vertically in Seaborn
If you pass the x parameter, then the plot will be vertical. It means plot will draw on x-axis.
# Import the Seaborn library as sns
import seaborn as sns

# Load the iris Dataset
iris = sns.load_dataset("iris")

# Plot the Histogram
sns.histplot(data=iris, x="sepal_length")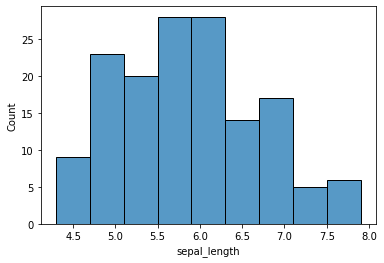
Example 2: Plot Histogram Horizontally
If you pass the y parameter, then the plot will be horizontal. It means plot will draw on y-axis.
# Import the Seaborn library as sns
import seaborn as sns

# Load the iris Dataset
iris = sns.load_dataset("iris")

# Plot the Histogram
sns.histplot(data=iris, y="sepal_length")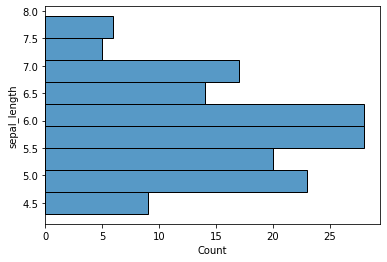
Example 3: Histogram Bins
You can also change the number of bins of histogram with the bins parameter.
# Import the Seaborn library as sns
import seaborn as sns

# Load the iris Dataset
iris = sns.load_dataset("iris")

# Plot the Histogram
sns.histplot(data=iris, x="sepal_length", bins=20)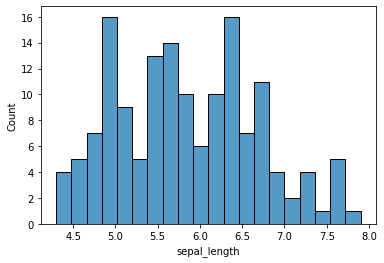
Example 4: Histogram Binwidth
If you want to change binwidth, then use the binwidth parameter and pass the value according to your requirement.
# Import the Seaborn library as sns
import seaborn as sns

# Load the iris Dataset
iris = sns.load_dataset("iris")

# Plot the Histogram
sns.histplot(data=iris, x="sepal_length", binwidth=1)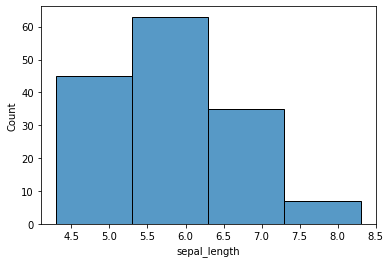
Example 5: Histogram kde
You can also draw kernel density estimate on histogram to visualize the distribution of data. For this just pass the kde parameter.
# Import the Seaborn library as sns
import seaborn as sns

# Load the iris Dataset
iris = sns.load_dataset("iris")

# Plot the Histogram
sns.histplot(data=iris, x="sepal_length", kde=True)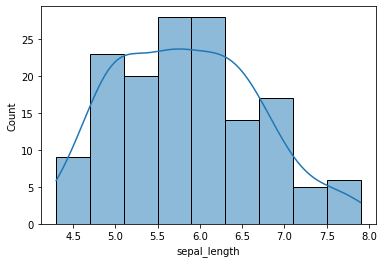
Example 6: Histogram with all numeric values of dataset
If you pass the dataset only without any parameter then it will plot the histogram for all numeric values.
# Import the Seaborn library as sns
import seaborn as sns

# Load the iris Dataset
iris = sns.load_dataset("iris")

# Plot the Histogram
sns.histplot(data=iris)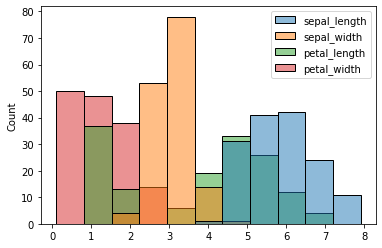
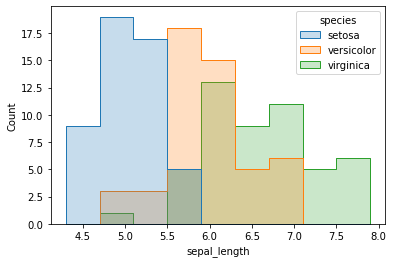
Example 7: Histogram Hue
If you want to find relation between two columns then use can use the hue parameter.
# Import the Seaborn library as sns
import seaborn as sns

# Load the iris Dataset
iris = sns.load_dataset("iris")

# Plot the Histogram
sns.histplot(data=iris, x="sepal_length", hue="species")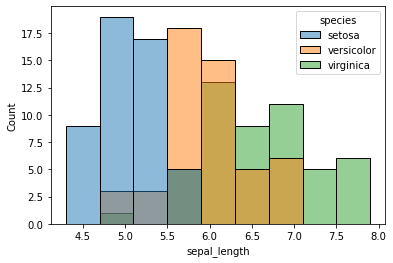
Example 8: Plot Stack Histogram in Seaborn
You can plot stack histogram with this code. It also helpful to see the relation.
# Import the Seaborn library as sns
import seaborn as sns

# Load the iris Dataset
iris = sns.load_dataset("iris")

# Plot the Histogram
sns.histplot(data=iris, x="sepal_length", hue="species", multiple="stack")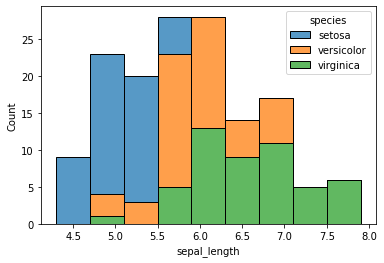
Example 9: Step Histogram
This type of histogram are very helpful to understand the pattern of distribution.
# Import the Seaborn library as sns
import seaborn as sns

# Load the iris Dataset
iris = sns.load_dataset("iris")

# Plot the Histogram
sns.histplot(data=iris, x="sepal_length", hue="species", element="step")