You can set the title in the Seaborn plot with the following code. In this article, you’ll see two examples with solutions. These examples help you to understand how to add a title to the Seaborn plot. I highly recommend you “Python Crash Course Book” to learn Python.
Example 1: Set title in Seaborn Plot (Histogram)
# Import the Seaborn library as sns
import seaborn as sns

# Load the iris Dataset
iris = sns.load_dataset("iris")

# Plot the Histogram and set title
sns.histplot(data=iris, x="petal_length").set(title='Histogram of Petal Length')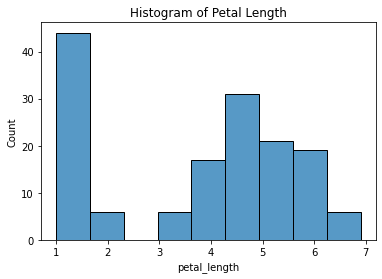
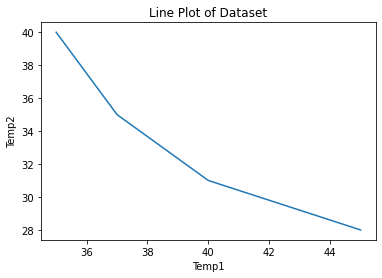
Example 2: Set title for Lineplot
# Import the required libraries
import seaborn as sns
import pandas as pd

# Create Dataset
dataset = pd.DataFrame({"Temp1": [35, 37, 40, 45],
                      "Temp2": [40, 35, 31, 28]})

# Line Plot and Title
sns.lineplot(data=dataset, x="Temp1", y="Temp2").set(title='Line Plot of Dataset')