You can set the labels in Seaborn with the following code. The given example helps you to understand how to set the labels in Seaborn. I highly recommend you “Python Crash Course Book” to learn Python.
# Import the required libraries
import seaborn as sns
import matplotlib.pyplot as plt
# Load the Dataset
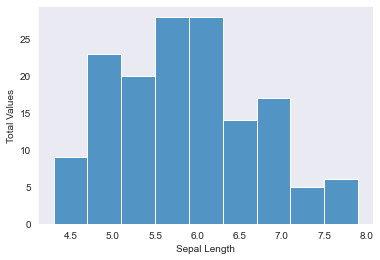
dataset = sns.load_dataset("iris")
# Plot the Histogram
a = sns.histplot(x="sepal_length", data=dataset)
# Set the labels
a.set(xlabel='Sepal Length', ylabel='Total Values')
# Display the plot
plt.show()Output: