You can change the color of the Seaborn heatmap with the following code. The given examples help you to understand how to change the color of the Seaborn heatmap. I highly recommend you “Python Crash Course Book” to learn Python.
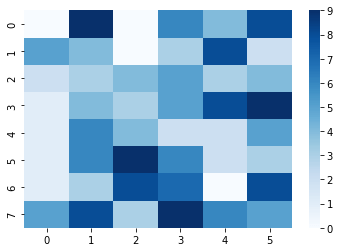
Example 1: “Blues” Color of Seaborn Heatmap
# Import the required libraries
import numpy as np
import seaborn as sns
import matplotlib.pyplot as plt

# Create NumPy Array
data = np.random.randint(10, size=(8,6))

# Create Heatmap
sns.heatmap(data, cmap="Blues")

# Display the plot
plt.show()
Output:
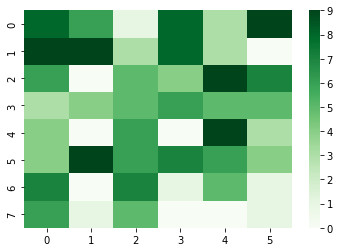
Example 2: “Greens” Color of Seaborn Heatmap
# Import the required libraries
import numpy as np
import seaborn as sns
import matplotlib.pyplot as plt

# Create NumPy Array
data = np.random.randint(10, size=(8,6))

# Create Heatmap
sns.heatmap(data, cmap="Greens")

# Display the plot
plt.show()
Output:
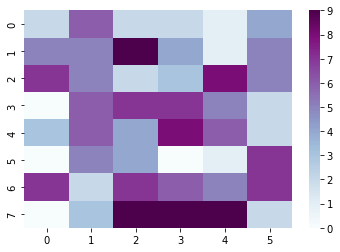
Example 3: “BuPu”
# Import the required libraries
import numpy as np
import seaborn as sns
import matplotlib.pyplot as plt

# Create NumPy Array
data = np.random.randint(10, size=(8,6))

# Create Heatmap
sns.heatmap(data, cmap="BuPu")

# Display the plot
plt.show()
Output:
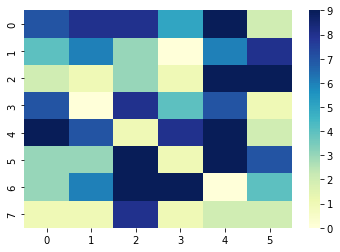
Example 4: “YlGnBu”
# Import the required libraries
import numpy as np
import seaborn as sns
import matplotlib.pyplot as plt

# Create NumPy Array
data = np.random.randint(10, size=(8,6))

# Create Heatmap
sns.heatmap(data, cmap="YlGnBu")

# Display the plot
plt.show()
Output: