You can plot the area chart in Seaborn with the following code. The given example helps you to understand how to create an area chart in Seaborn. I highly recommend you “Python Crash Course Book” to learn Python.
Example: Plot Area Chart in Seaborn
# Import the required libraries
import seaborn as sns
import pandas as pd
import matplotlib.pyplot as plt
# Data
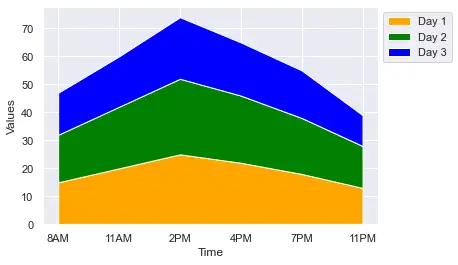
df = pd.DataFrame({'time': ['8AM', '11AM', '2PM', '4PM', '7PM', '11PM'],
'day1': [15, 20, 25, 22, 18, 13],
'day2': [17, 22, 27, 24, 20, 15],
'day3': [15, 18, 22, 19, 17, 11]})
# Select colors
selected_colors = ['orange', 'green', 'blue']
# Plot the Area Chart
plt.stackplot(df.time, df.day1, df.day2, df.day3,
labels = ['Day 1', 'Day 2', 'Day 3'],
colors = selected_colors)
# Add legend outside the plot
plt.legend(loc= 2, bbox_to_anchor = (1,1))
# Add the Labels to Axes
plt.xlabel('Time')
plt.ylabel('Values')
# Display the Chart
plt.show()Output: