You can plot multiple columns in Seaborn with the following code. The given examples help you to understand how to plot multiple columns. I highly recommend you “Python Crash Course Book” to learn Python.
Example 1: Plot multiple columns of dataset
# Import the required libraries
import pandas as pd
import matplotlib.pyplot as plt
import seaborn as sns

# Load the Dataset
df = sns.load_dataset("titanic")

# Plot multiple columns
sns.barplot(x="class", y="survived", hue="sex", data=df, palette="Set3")

# Display the plot
plt.show()
Output:

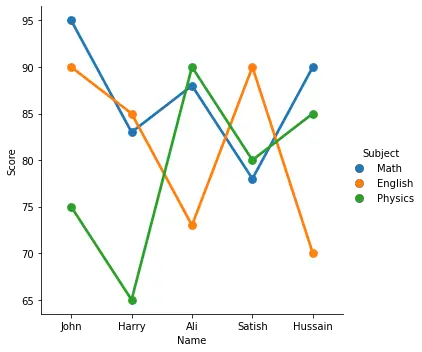
Example 2:
import pandas as pd
import seaborn as sns

data = pd.DataFrame({'Name':["John","Harry","Ali","Satish","Hussain"],
                   'Math':[95, 83, 88, 78, 90],
                   'English':[90, 85, 73, 90, 70],
                   'Physics':[75, 65, 90, 80, 85]})

# Convert the data
df = data.melt('Name', var_name='Subject', value_name='Score')

# Plot multiple columns
sns.catplot(x="Name", y="Score", hue='Subject', data=df, kind='point')

# Display Plot
plt.show()
Output: