You can plot multiple lines in Seaborn with the following code. The given example with the solution will help you to understand how to plot multiple lines in Seaborn. I highly recommend the “Python Crash Course Book” to learn Python.
Example: Plot multiple lines in Seaborn
# Import the required libraries
import pandas as pd
import seaborn as sns
import matplotlib.pyplot as plt
# Data
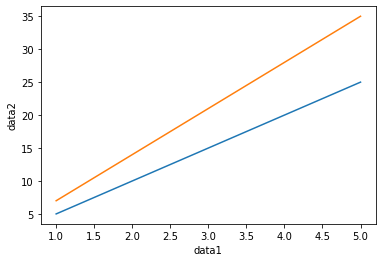
data = pd.DataFrame({"data1":[1, 2, 3, 4, 5],
"data2":[5, 10, 15, 20, 25],
"data3":[7, 14, 21, 28, 35]})
# For multiple plots
fig, ax = plt.subplots()
# Plot multiple lines
ax= sns.lineplot(x='data1', y='data2', data=data)
ax1 = sns.lineplot(x='data1', y='data3', data=data)
# Display
plt.show()Output: