You can change the x-axis range in Seaborn with the following code. The given example helps you to understand how to change the x-axis range of the Seaborn plot. I highly recommend you “Python Crash Course Book” to learn Python.
Example: Change x-axis range
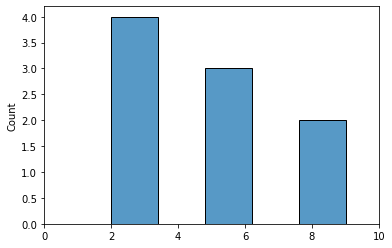
# Import the required libraries
import seaborn as sns
import matplotlib.pyplot as plt

# Create Data
dataset = [2,2,2,2,6,6,6,9,9]

# Create Histogram
sns.histplot(data = dataset)

# Select x-axis range
plt.xlim(0, 10)

# Display the plot
plt.show()
Output: