Heatmap is used to plot rectangular data in matrix form with different colors. You can make a heatmap in Seaborn with the given code. I highly recommend you “Python Crash Course Book” to learn Python. In this article, you’ll see four examples in which you learn about these things.
- Seaborn Heatmap Colors
- Seaborn Heatmap Labels
- Seaborn Heatmap Title
- Seaborn Heatmap Font Size
- Seaborn Heatmap Size
Example 1: Heatmap
# Import the required libraries
import numpy as np
import seaborn as sns
import matplotlib.pyplot as plt

# Create NumPy Array
data = np.random.randint(10, size=(10,5))

# Create simple Heatmap
sns.heatmap(data)

# Display the Heatmap
plt.show()
Output:

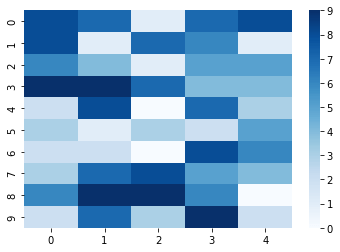
Example 2: Seaborn Heatmap Colors
# Import the required libraries
import numpy as np
import seaborn as sns
import matplotlib.pyplot as plt

# Create NumPy Array
data = np.random.randint(10, size=(10,5))

# Creat Heatmap with mention color
sns.heatmap(data, cmap="Blues")
# Other Colors you can try: Greens, BuPu, YlGnBu

# Display the Heatmap
plt.show()
Output:
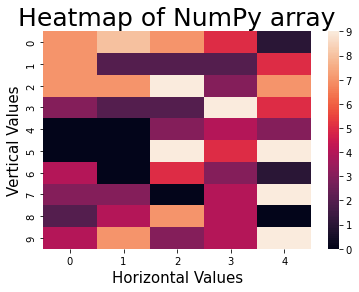
Example 3: Seaborn Heatmap Title, Labels, Font Size
# Import the required libraries
import numpy as np
import seaborn as sns
import matplotlib.pyplot as plt

# Create NumPy Array
data = np.random.randint(10, size=(10,5))

# Create Simple Heatmap
sns.heatmap(data)

# Set Title, Labels, Font Size
plt.title('Heatmap of NumPy array', fontsize = 25)
plt.xlabel('Horizontal Values', fontsize = 15)
plt.ylabel('Vertical Values', fontsize = 15)

# Display the Heatmap
plt.show()
Output:
Example 4: Seaborn Heatmap Size
# Import the required libraries
import numpy as np
import seaborn as sns
import matplotlib.pyplot as plt

# Create NumPy Array
data = np.random.randint(10, size=(10,5))

# Select Heatmap Size
plt.figure(figsize=(15,5))

# Create simple Heatmap
sns.heatmap(data)

# Display the Heatmap
plt.show()
Output: