You can set the Seaborn style with the following code. The given example helps you to understand how to set the Seaborn style. I highly recommend you “Python Crash Course Book” to learn Python.
# Import the Seaborn Library
import seaborn as sns
# You can set any style from these available styles.
# darkgrid, whitegrid, dark, white, ticks
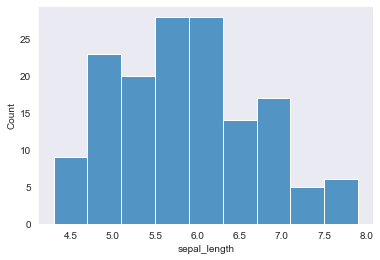
sns.set_style("dark")
# Load the Dataset
dataset = sns.load_dataset("iris")
# Plot the Histogram
sns.histplot(x="sepal_length", data=dataset)