You can plot a time series plot in Seaborn with the following code. The given example helps you to understand how to make a time series plot. I highly recommend you “Python Crash Course Book” to learn Python.
# Import the required libraries
import seaborn as sns
import matplotlib.pyplot as plt
import pandas as pd
# Load the Dataset
df = pd.read_csv("weather.csv")
# Increase plot size
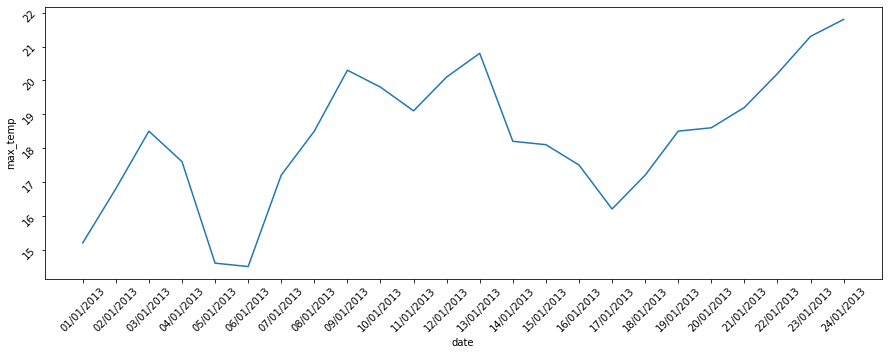
plt.figure(figsize=(15,5))
# Draw Line Plot
ax = sns.lineplot(x="date", y="max_temp", data=df)
# Rotate axes values
ax.tick_params(rotation=45)
# Display the plot
plt.show()Output: