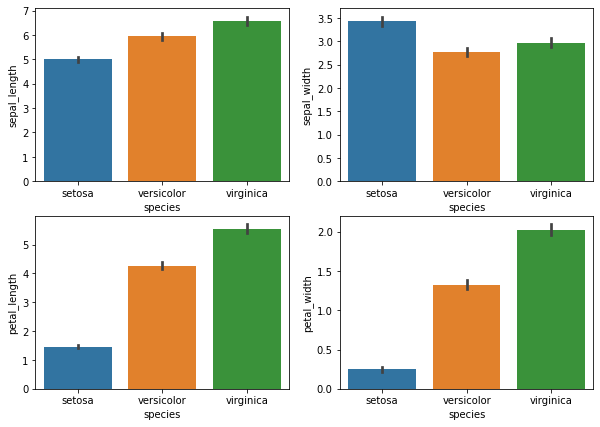
You can plot the multiple graphs in Seaborn with the following code. The given example helps you to understand how to make multiple graphs in Python using Seaborn. I highly recommend you “Python Crash Course Book” to learn Python.
# Import the required libraries
import seaborn as sns
import matplotlib.pyplot as plt
import numpy as np
import pandas as pd

# Set (No. of rows and columns for multiple plots) and (Figure Size)
fig, ax = plt.subplots(2, 2, figsize=(10, 7))

# Load the Dataset
dataset = sns.load_dataset("iris")

# Multiple Barplots
sns.barplot(ax=ax[0, 0], data=dataset, x='species', y='sepal_length')
sns.barplot(ax=ax[0, 1], data=dataset, x='species', y='sepal_width')
sns.barplot(ax=ax[1, 0], data=dataset, x='species', y='petal_length')
sns.barplot(ax=ax[1, 1], data=dataset, x='species', y='petal_width')
Output: