You can easily plot a barplot in Seaborn with the following code. The given examples with solutions will help you to understand how to plot a barplot in Seaborn. I highly recommend the “Python Crash Course Book” to learn Python.
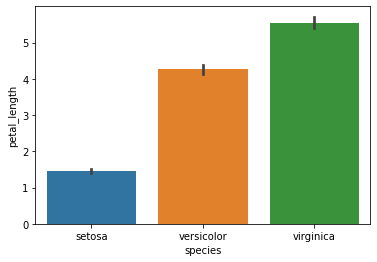
Example 1: Vertical Barplot in Seaborn
# Import the required libraries
import seaborn as sns
import matplotlib.pyplot as plt

# Load the Dataset
dataset = sns.load_dataset("iris")

# Draw Bar Plot
sns.barplot(x="species", y="petal_length", data=dataset)

# Display the plot
plt.show()
Output:
Example 2: Horizontal Barplot in Seaborn
# Import the required libraries
import seaborn as sns
import matplotlib.pyplot as plt

# Load the Dataset
dataset = sns.load_dataset("iris")

# Draw Bar Plot
sns.barplot(x="petal_length", y="species", data=dataset)

# Display the plot
plt.show()
Output:

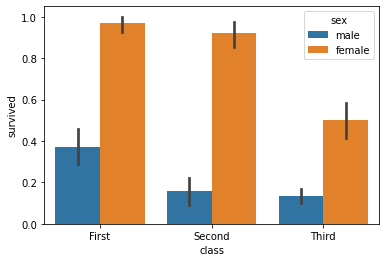
Example 3: Barplot with hue parameter
# Import the required libraries
import seaborn as sns
import matplotlib.pyplot as plt

# Load the Dataset
df = sns.load_dataset("titanic")

# Draw Bar Plot
sns.barplot(x="class", y="survived", hue="sex", data=df)

# Display the plot
plt.show()
Output: