You can create a grouped barplot in Seaborn with the following code. The given example helps you to understand how to make a grouped barplot in Seaborn. I highly recommend you “Python Crash Course Book” to learn Python.
Example: Grouped Barplot in Seaborn
# Import the required libraries
import pandas as pd
import matplotlib.pyplot as plt
import seaborn as sns
# Load the Dataset
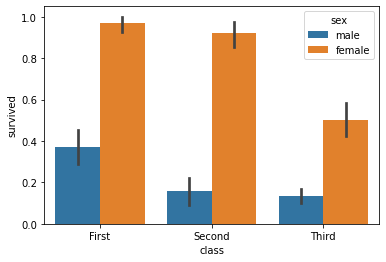
dataset = sns.load_dataset("titanic")
# Create grouped bar chart
sns.barplot(x='class', y='survived', hue='sex', data=dataset)
# Display the plot
plt.show()Output: