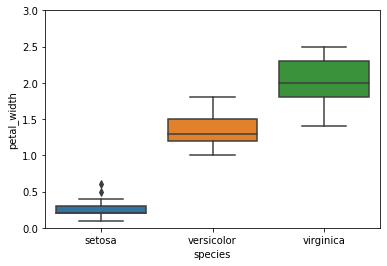
You can change the y-axis scale in Seaborn with the following code. The given example helps you to understand how to change the y-axis scale of the Seaborn plot. I highly recommend you “Python Crash Course Book” to learn Python.
Example: Change y-axis scale
# Import the required libraries
import numpy as np
import seaborn as sns
import matplotlib.pyplot as plt

# Load the Dataset
df = sns.load_dataset("iris")

# Create Boxplot
sns.boxplot(x="species", y="petal_width", data=df)

# Set the y-axis scale/range
plt.ylim(0, 3)

# Display the plot
plt.show()
Output: