
You can change the Seaborn theme with the following code. The given examples help you to understand how to change the Seaborn theme. I highly recommend you “Python Crash Course Book” to learn Python. In this article, You’ll see five themes that are available in Seaborn.
Example 1: Change Seaborn theme to “dark”
# Import the required libraries
import numpy as np
import seaborn as sns
import matplotlib.pyplot as plt

# Select Theme
sns.set_style("dark")

# Load the Dataset
dataset = sns.load_dataset("iris")

# Create Boxplot
sns.boxplot(x="species", y="petal_length", data=dataset)

# Display the plot
plt.show()
Output:

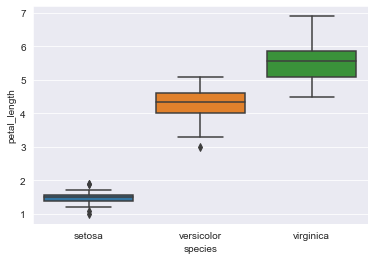
Example 2: Change Seaborn theme to “darkgrid”
# Import the required libraries
import numpy as np
import seaborn as sns
import matplotlib.pyplot as plt

# Select Theme
sns.set_style("darkgrid")

# Load the Dataset
dataset = sns.load_dataset("iris")

# Create Boxplot
sns.boxplot(x="species", y="petal_length", data=dataset)

# Display the plot
plt.show()
Output:
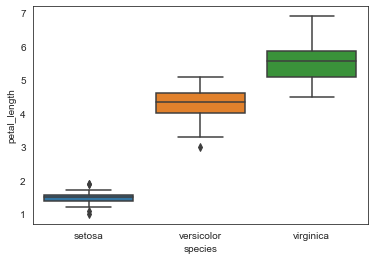
Example 3: White Seaborn theme
# Import the required libraries
import numpy as np
import seaborn as sns
import matplotlib.pyplot as plt

# Select Theme
sns.set_style("white")

# Load the Dataset
dataset = sns.load_dataset("iris")

# Create Boxplot
sns.boxplot(x="species", y="petal_length", data=dataset)

# Display the plot
plt.show()
Output:
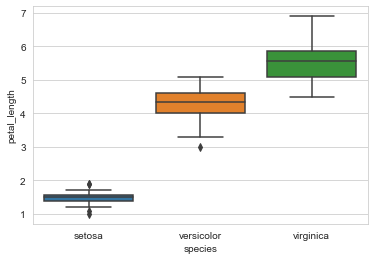
Example 4: Whitegrid Seaborn theme
# Import the required libraries
import numpy as np
import seaborn as sns
import matplotlib.pyplot as plt

# Select Theme
sns.set_style("whitegrid")

# Load the Dataset
dataset = sns.load_dataset("iris")

# Create Boxplot
sns.boxplot(x="species", y="petal_length", data=dataset)

# Display the plot
plt.show()
Output:
Example 5: Ticks Seaborn theme
# Import the required libraries
import numpy as np
import seaborn as sns
import matplotlib.pyplot as plt

# Select Theme
sns.set_style("ticks")

# Load the Dataset
dataset = sns.load_dataset("iris")

# Create Boxplot
sns.boxplot(x="species", y="petal_length", data=dataset)

# Display the plot
plt.show()
Output:


