You can easily plot in Matplotlib with the following code. If you want to learn Python then I will highly recommend you to read This Book.
How to Plot in Matplotlib
from matplotlib import pyplot as plt

x = [1,2,3,4,5]
y = [5,10,15,20,25]

plt.title("Integers and Multiple")
plt.xlabel("Integers")
plt.ylabel("Multiple")

plt.plot(x,y,color ='red')
plt.show()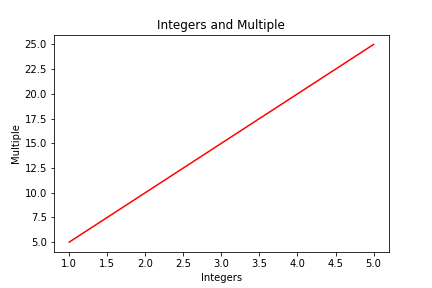
Scatter Plot in Matplotlib
from matplotlib import pyplot as plt

x = [1,2,3,4,5]
y = [5,10,15,20,25]

plt.title("Integers and Multiple")
plt.xlabel("Integers")
plt.ylabel("Multiple")

plt.scatter(x,y,color ='red')
plt.show()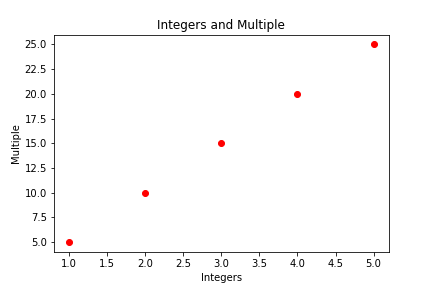
People are also reading:
What is Computer Vision? Examples, Applications, Techniques
Top 10 Computer Vision Books with Python
Books for Machine Learning (ML)