You can plot a circle in Matplotlib with the following code. If you want to learn Python then I will highly recommend you to read This Book.
Plot a Colored Circle using Matplotlib
import matplotlib.pyplot as plt

figure, axes = plt.subplots()

axes.add_patch(plt.Circle((0, 0), 0.4, color='green', alpha=0.7))

axes.set_aspect('equal', adjustable='datalim')

plt.title('Colored Circle')

axes.plot()
plt.show()
Plot a un-colored circle using Matplotlib
import matplotlib.pyplot as plt

figure, axes = plt.subplots()

axes.add_patch(plt.Circle((0, 0), 0.4, fill = False))

axes.set_aspect('equal', adjustable='datalim')

plt.title('Un-colored Circle')

axes.plot()
plt.show()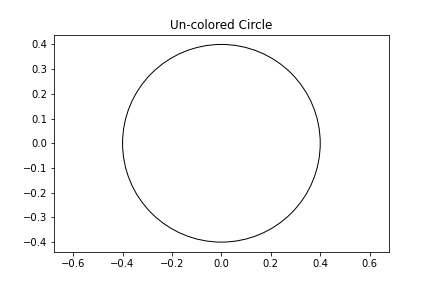
People are also reading:
What is Computer Vision? Examples, Applications, Techniques
Top 10 Computer Vision Books with Python
Books for Machine Learning (ML)