You can move legend outside plot in Matplotlib with the following code. If you want to learn Python then I will highly recommend you to read This Book.

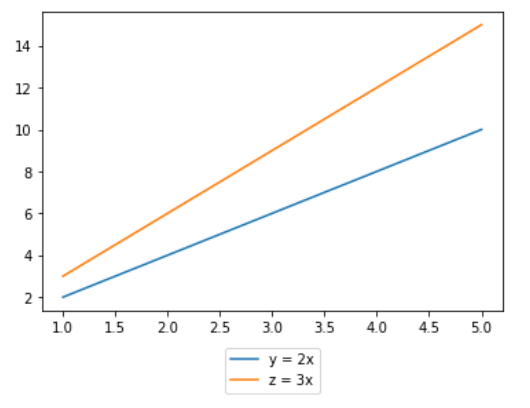
Add legend at lower center position outside the plot
from matplotlib import pyplot as plt
x = [1,2,3,4,5]
y = [2,4,6,8,10]
z = [3,6,9,12,15]

plt.plot(x,y, label ="y = 2x")
plt.plot(x,z, label ="z = 3x")

plt.legend(bbox_to_anchor =(0.5,-0.1), loc='upper center')
#loc is used for plot position
#bbox_to_anchor is used for legend position
plt.show()
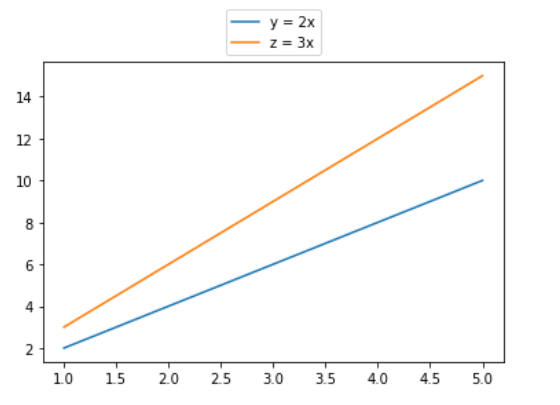
Add legend at upper center position outside the plot
from matplotlib import pyplot as plt
x = [1,2,3,4,5]
y = [2,4,6,8,10]
z = [3,6,9,12,15]

plt.plot(x,y, label ="y = 2x")
plt.plot(x,z, label ="z = 3x")

plt.legend(bbox_to_anchor =(0.5,1), loc='lower center')

plt.show()
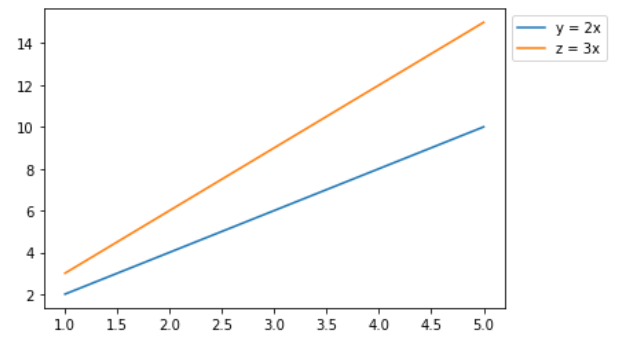
Add legend at upper right position outside the plot
from matplotlib import pyplot as plt
x = [1,2,3,4,5]
y = [2,4,6,8,10]
z = [3,6,9,12,15]

plt.plot(x,y, label ="y = 2x")
plt.plot(x,z, label ="z = 3x")

plt.legend(bbox_to_anchor =(1,1), loc='upper left')

plt.show()
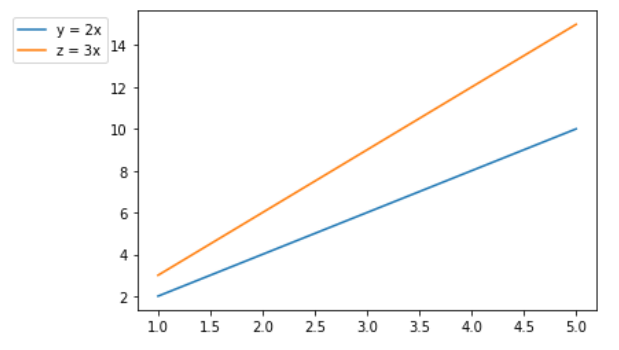
Add legend at upper left position outside the plot
from matplotlib import pyplot as plt
x = [1,2,3,4,5]
y = [2,4,6,8,10]
z = [3,6,9,12,15]

plt.plot(x,y, label ="y = 2x")
plt.plot(x,z, label ="z = 3x")

plt.legend(bbox_to_anchor =(-0.1,1), loc='upper right')

plt.show()
People are also reading:
What is Computer Vision? Examples, Applications, Techniques
Top 10 Computer Vision Books with Python
Books for Machine Learning (ML)