You can plot a line graph in Matplotlib with the following code. If you want to learn Python then I will highly recommend you to read This Book.

Line Graph 1
from matplotlib import pyplot as plt

x = [1,2,3,4,5]
y = [4,8,12,16,20]

plt.title("Line Graph")
plt.xlabel("X_Axis")
plt.ylabel("Y_Axis")

plt.plot(x,y,color ='green')

plt.show()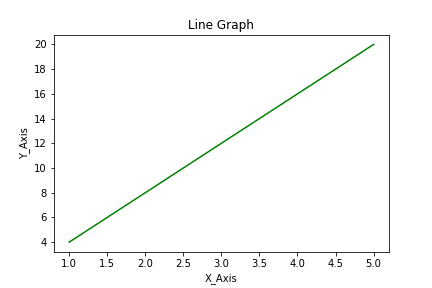
Line Graph 2
from matplotlib import pyplot as plt

x = [2,4,6,8,10]
y = [7,3,5,1,9]

plt.title("Line Graph")
plt.xlabel("X_Axis")
plt.ylabel("Y_Axis")

plt.plot(x,y,color ='blue')

plt.show()
People are also reading:
What is Computer Vision? Examples, Applications, Techniques
Top 10 Computer Vision Books with Python
Books for Machine Learning (ML)