You can plot a bar graph in Matplotlib with the following code. If you want to learn Python then I will highly recommend you to read This Book.
Bar graph using Matplotlib
import matplotlib.pyplot as plt

x = ['Tesla', 'Google', 'Amazon', 'Apple', 'Facebook']
y = [728, 2263, 2138, 142, 191]

plt.bar(x,y,color ='green',width = 0.5)

plt.xlabel("Companies",fontsize = 12)
plt.ylabel("Stock Price",fontsize = 12)
plt.title("Stock Price in May",fontsize = 20)

plt.show()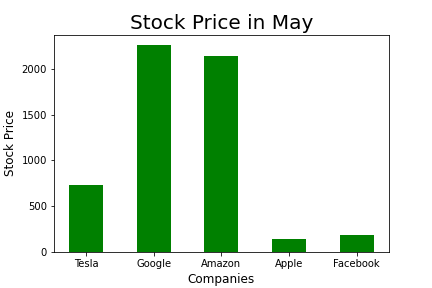
People are also reading:
What is Computer Vision? Examples, Applications, Techniques
Top 10 Computer Vision Books with Python
Books for Machine Learning (ML)