You can plot a function in Matplotlib with the following code. If you want to learn Python then I will highly recommend you to read This Book.
Plot a function in Matplotlib
import numpy as np
from matplotlib import pyplot as plt

x = [1,2,3,4,5]

def fun(x):
    return np.exp(x)

plt.plot(x, fun(x),color='g')
plt.show()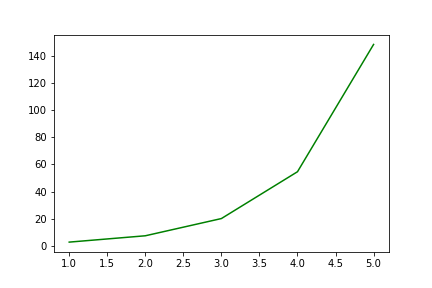
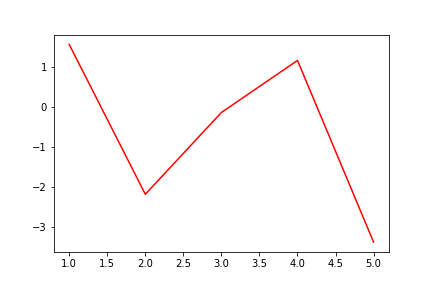
import numpy as np
from matplotlib import pyplot as plt

x = [1,2,3,4,5]
y = np.tan(x)

plt.plot(x, y,color='red')
plt.show()
People are also reading:
What is Computer Vision? Examples, Applications, Techniques
Top 10 Computer Vision Books with Python
Books for Machine Learning (ML)