You can add a vertical line in Matplotlib with the following code. If you want to learn Python then I will highly recommend you to read This Book.

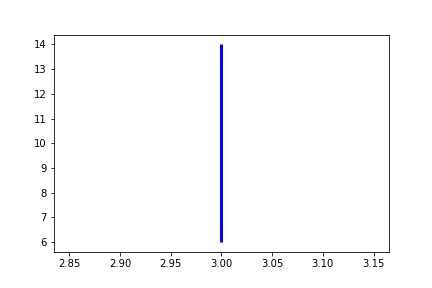
Method 1
import matplotlib.pyplot as plt

fig, ax = plt.subplots()

ax.vlines(x=3, ymin=6, ymax=14, linewidth=3, color='b')

plt.show()
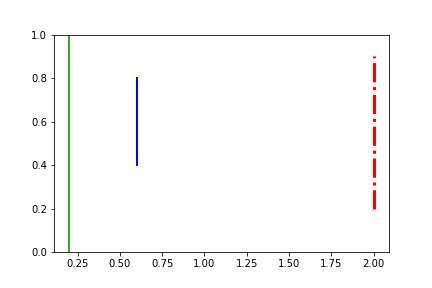
Method 2
import matplotlib.pyplot as plt

plt.axvline(x=0.2, color='green', linestyle='-')
plt.axvline(x=0.6, ymin=0.4, ymax=0.8, linewidth=2, color='blue')
plt.axvline(x=2, ymin=0.2, ymax=0.9,color='red', linestyle='-.', linewidth = 3)

plt.show()
People are also reading:
What is Computer Vision? Examples, Applications, Techniques
Top 10 Computer Vision Books with Python
Books for Machine Learning (ML)