You can add text in Matplotlib with the following code. If you want to learn Python then I will highly recommend you to read This Book.
Add text inside the Plot
import matplotlib.pyplot as plt

x = [1,2,3,4,5]
y = [5,10,15,20,25]

plt.text(2, 15, 'Line', fontsize = 25)
plt.xlabel("Integers")
plt.ylabel("Multiple")

plt.plot(x, y, color='red')
plt.show()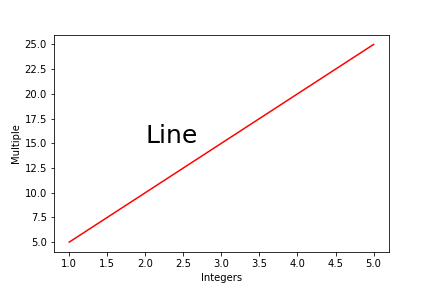
Add text box inside the Plot
import matplotlib.pyplot as plt

x = [1,2,3,4,5]
y = [5,10,15,20,25]

plt.text(2, 15, 'Line', fontsize = 25, bbox = dict(facecolor = 'green', alpha = 0.3))

plt.plot(x, y, color='red')

plt.xlabel("Integers")
plt.ylabel("Multiple")

plt.show()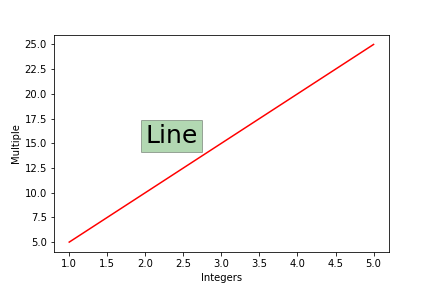
Text and Arrow inside the Plot
import matplotlib.pyplot as plt

x = ['Tesla', 'Google', 'Amazon', 'Apple', 'Facebook']
y = [760, 2500, 2800, 150, 186]

plt.bar(x,y)

plt.xlabel("Companies",fontsize = 12)
plt.ylabel("Stock Price",fontsize = 12)
plt.title("Stock Price in March",fontsize = 20)

plt.annotate('Top ($2800)', xy = (2.4, 1500),fontsize = 16, xytext = (3, 1500), arrowprops = dict(facecolor = 'yellow'))

plt.show()
People are also reading:
What is Computer Vision? Examples, Applications, Techniques
Top 10 Computer Vision Books with Python
Books for Machine Learning (ML)