You can add a grid in Matplotlib with the following code. If you want to learn Python then I will highly recommend you to read This Book.

Add Grid Vertically
from matplotlib import pyplot as plt

x = [1,2,3,4,5]
y = [5,10,15,20,25]

plt.title("Numbers and Products")
plt.xlabel("Numbers")
plt.ylabel("Products")

plt.grid(axis = 'x')

plt.plot(x,y)
plt.show()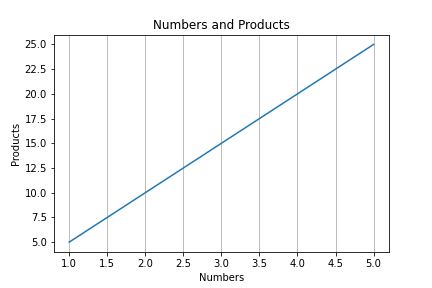
Add Grid Horizontally
from matplotlib import pyplot as plt

x = [1,2,3,4,5]
y = [5,10,15,20,25]

plt.title("Numbers and Products")
plt.xlabel("Numbers")
plt.ylabel("Products")

plt.grid(axis = 'y')

plt.plot(x,y)
plt.savefig('figure.png')
plt.show()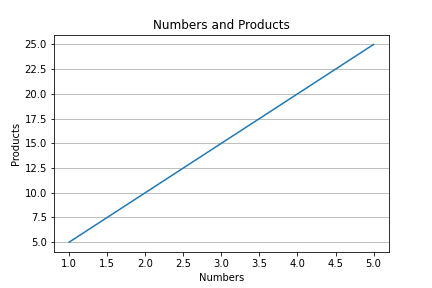
Add the Grid Horizontally and Vertically
from matplotlib import pyplot as plt

x = [1,2,3,4,5]
y = [5,10,15,20,25]

plt.title("Numbers and Products")
plt.xlabel("Numbers")
plt.ylabel("Products")

plt.grid(color = 'red', linewidth = 0.8, linestyle = ':')
plt.plot(x,y)
plt.show()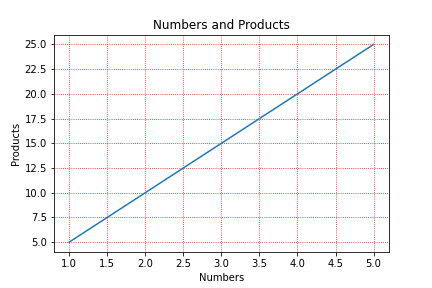
People are also reading:
What is Computer Vision? Examples, Applications, Techniques
Top 10 Computer Vision Books with Python
Books for Machine Learning (ML)