
The Bootstrap
Confidence without a formula.
The founder of Harbor Coffee asks about the typical spend per buyer. You report the median, and they ask how sure you are. For an average, you have a formula. For a median, there's no simple formula in your notes. So what do you do? There's a wonderfully simple trick, and it only needs a computer.
- What's the typical spend?
- How sure are you?
- No simple formula
Pull yourself up by your bootstraps
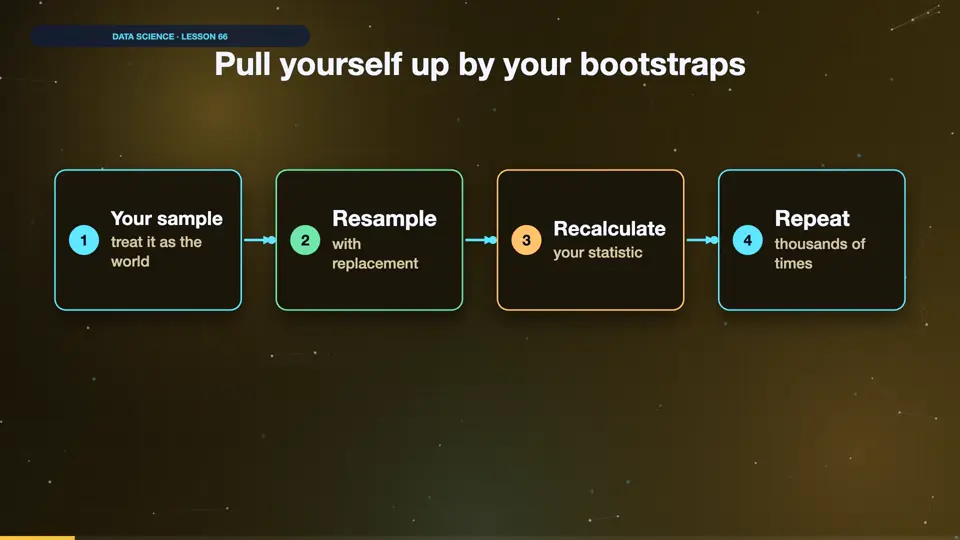
Imagine that your sample is the whole world. Draw from it at random, with replacement, until you have a new sample of the same size. Some people will appear twice, and others won't appear at all. Calculate your statistic. Repeat that thousands of times. The spread of those answers shows how much your statistic could vary.
- Your sampletreat it as the world
- Resamplewith replacement
- Recalculateyour statistic
- Repeatthousands of times
A range for the median
We take every buyer in the experiment, and we find the median spend. Then we loop five thousand times. Each time, we draw a sample of the same size, with replacement, and we save its median. The middle ninety five percent of those medians gives us our interval. Run it. Nine hundred and sixteen buyers, with a median of about eight dollars eleven. The interval runs from about seven sixty, to about eight fifty. That took just a few lines, with no formula, and it works just as well for almost any statistic that you can calculate.
import numpy as np
import pandas as pd

ab = pd.read_csv("ab_test.csv")
spend = ab[ab["spend"] > 0]["spend"].to_numpy()
print("Buyers:", len(spend))
print("Median spend:", round(np.median(spend), 2))

rng = np.random.default_rng(0)
medians = []
for _ in range(5000):
    resample = rng.choice(spend, len(spend), replace=True)
    medians.append(np.median(resample))

low, high = np.percentile(medians, [2.5, 97.5])
print(f"95% interval: {low:.2f} to {high:.2f}")Buyers: 916 Median spend: 8.11 95% interval: 7.60 to 8.52
When the bootstrap fails
It's powerful, but it isn't magic. It can't fix a biased sample, because it only reshuffles what you've got. It's poor for extremes, such as the maximum, because it can't produce a value larger than one it has seen. With time series, resampling single days destroys the pattern, so you must resample in blocks. And with very small samples, the result may be too narrow.
Using it for real
Here are some practical details. A thousand resamples is usually enough for a rough idea, and ten thousand costs little, so use more for a final number. To compare two groups, resample each one separately, and save the difference. If the interval misses zero, you've got evidence of a real gap. And keep your random seed, so that anyone can repeat your result. Then report it in plain words, as a range for the founder to think about.
Summary
Resample your own data, and you can put a range on almost anything. Next, what happens when you test forty things at once?
Key takeaways- Resample with replacement
- Works for most statistics
- Bias stays in