
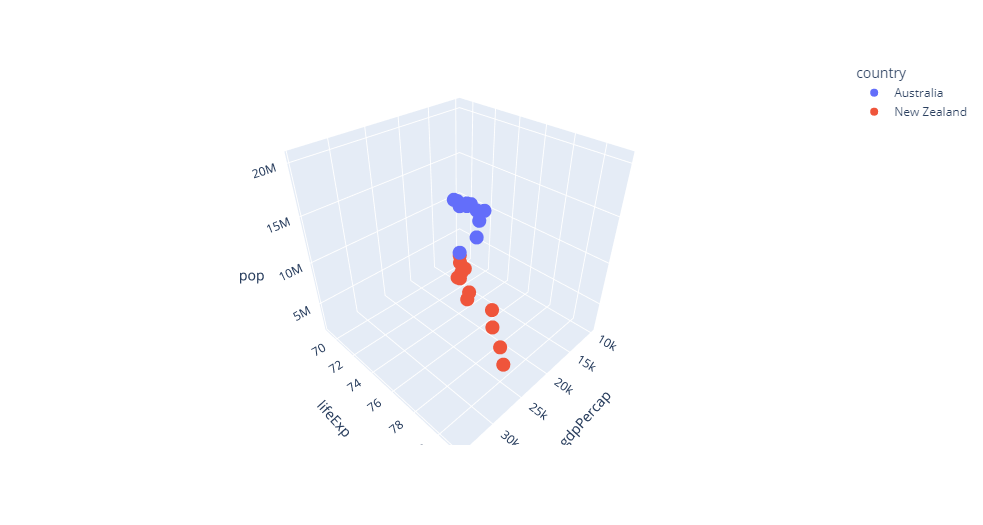
Plotly 3D Scatter Plot
In this Plotly tutorial, you will learn how to plot a 3D scatter plot in Python. You can use px.scatter_3d() function to plot a 3D Scatter Plot. Output: Free learning resources: AiHints, CodeAllow
In this Plotly tutorial, you will learn how to plot a 3D scatter plot in Python. You can use px.scatter_3d() function to plot a 3D Scatter Plot. Output: Free learning resources: AiHints, CodeAllow
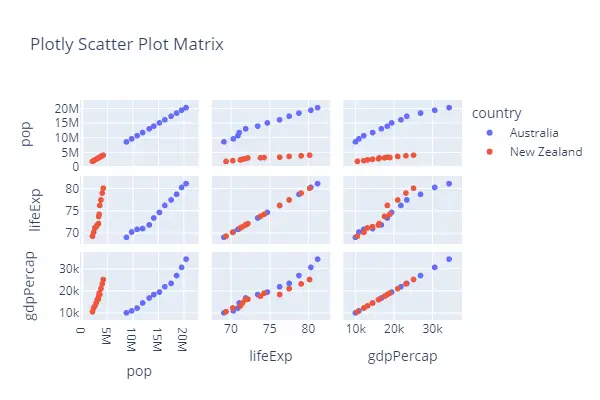
In this Plotly tutorial, you will learn how to plot a scatter plot matrix in Python. You can use px.scatter_matrix() function to plot a scatter plot matrix. Output: Free learning resources: AiHints, CodeAllow
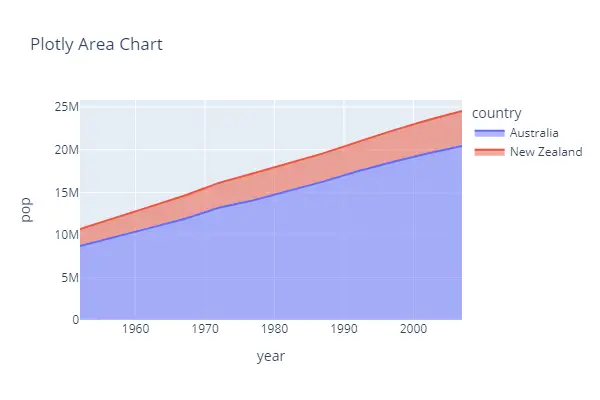
In this Plotly tutorial, you will learn how to plot an area chart in Python. You can use px.area() function to plot an area chart. Output: Free learning resources: AiHints, CodeAllow
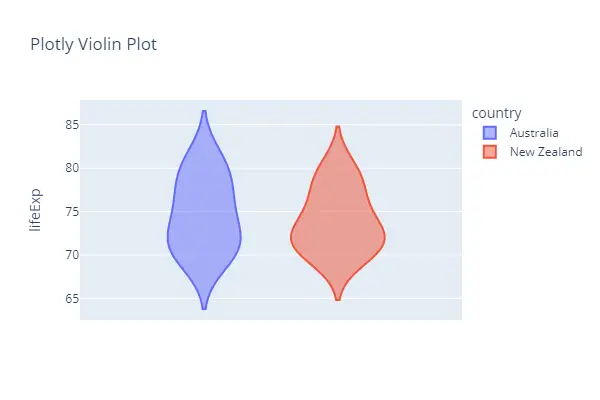
In this Plotly tutorial, you will learn how to plot a violin plot in Python. You can use px.violin() function to plot a violin plot. Output: Free learning resources: AiHints, CodeAllow
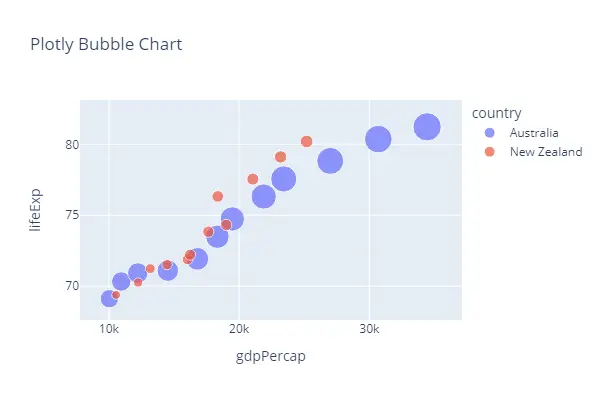
In this Plotly tutorial, you will learn how to plot a bubble chart in Python. The size parameter is used for the bubble chart in the following code. Free learning resources: AiHints, CodeAllow
In this Plotly tutorial, you will learn how to plot a pie chart in Python. You can use px.pie() function to plot a pie chart. Output: Free learning resources: AiHints, CodeAllow
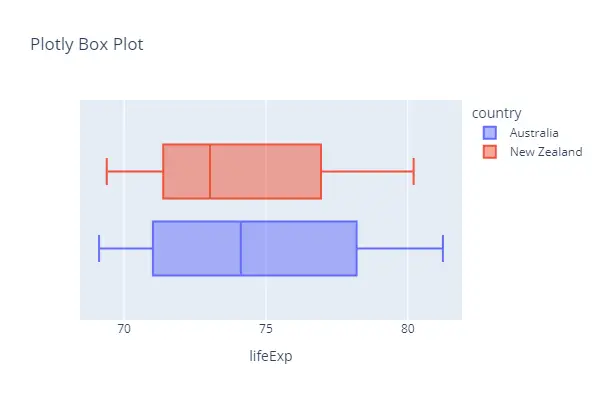
In this Plotly tutorial, you will learn how to plot a box plot in Python. You can use px.box() function to plot a box plot. Free learning resources: AiHints, CodeAllow
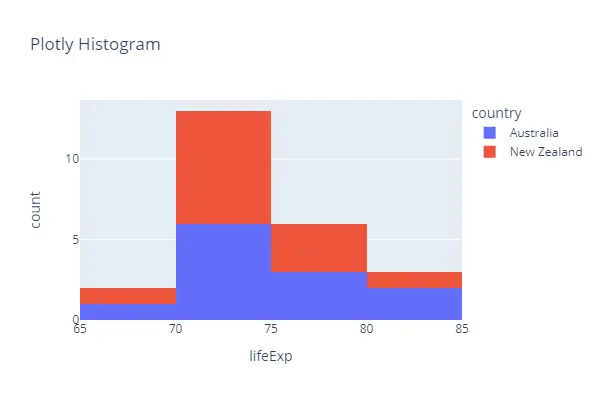
In this Plotly tutorial, you will learn how to plot a histogram in Python. You can use px.histogram() function to plot a histogram. Example 1 Output: Example 2 Output: Free learning resources: AiHints, CodeAllow
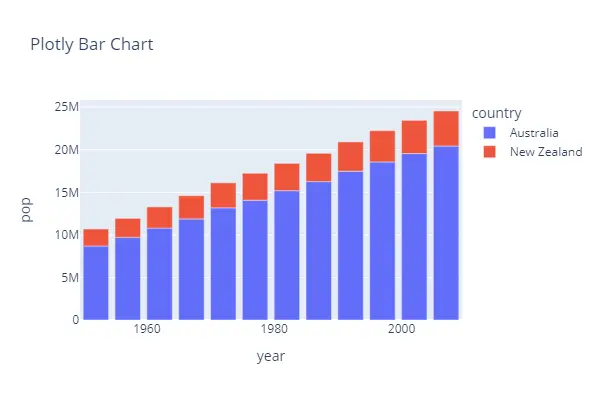
In this Plotly tutorial, you will learn how to plot a bar chart in Python. You can use px.bar() function to plot a bar chart. Example 1 Output: Example 2 Output: Free learning resources: AiHints, CodeAllow
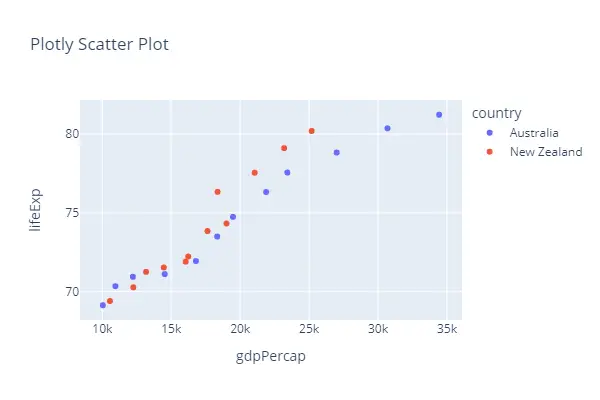
In this Plotly tutorial, you will learn how to plot a scatter plot in Python. You can use px.scatter() function to plot a scatter plot. Output: Free learning resources: AiHints, CodeAllow