In this Plotly tutorial, you will learn how to plot a network graph in Python.
# Import Plotly Module
import plotly.express as px
# Import Dataset
dataset = px.data.gapminder().query("continent=='Oceania'")
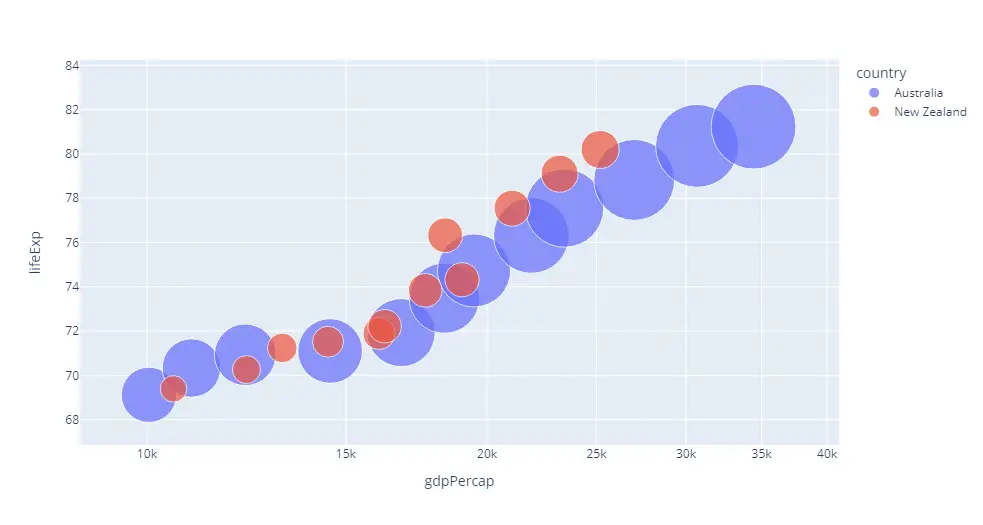
# Network Graph
plot = px.scatter(dataset, x="gdpPercap", y="lifeExp", color="country", size="pop", hover_name="country", log_x=True, size_max=60)
# Show the Plot
plot.show()Output: