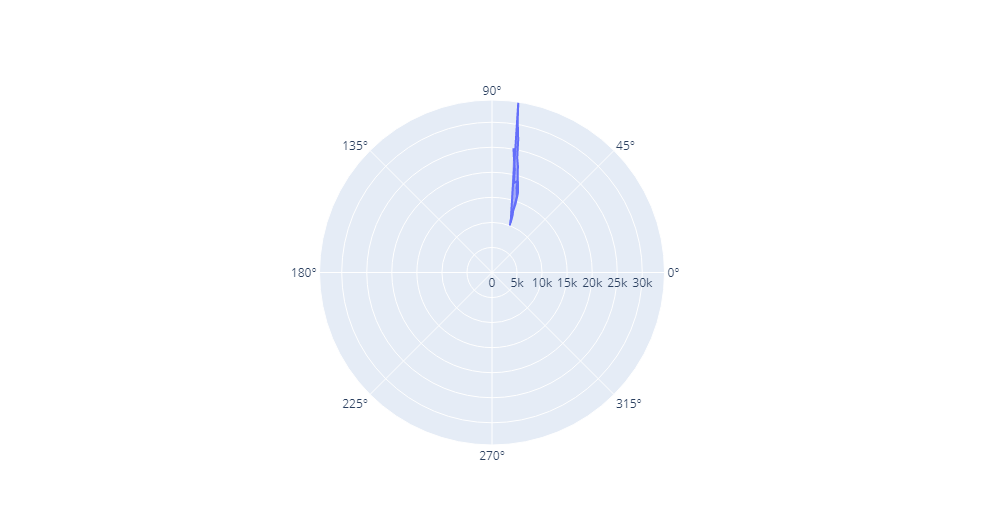
In this Plotly tutorial, you will learn how to plot polar plot in Python. You have to use go.Scatterpolar for polar plot.
# Import Plotly Module
import plotly.graph_objects as go

# Import Dataset
dataset = px.data.gapminder().query("continent=='Oceania'")

# Polar Plot
plot = go.Figure(go.Scatterpolar(r=dataset["gdpPercap"], theta=dataset["lifeExp"], fill="toself"))

# Show the Plot
plot.show()
Output: