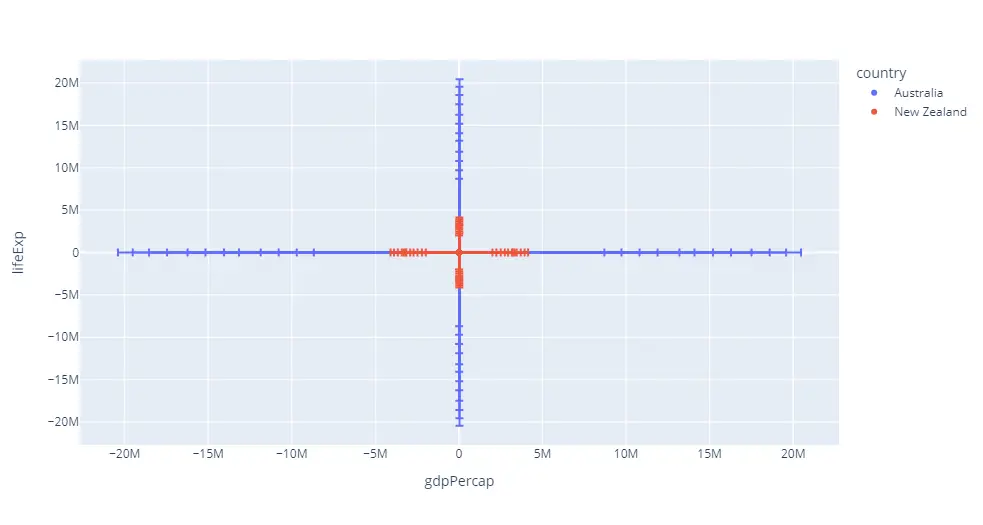
In this Plotly tutorial, you will learn how to plot error bars in Python. You have to use two parameters error_x and error_y to plot error bars.
# Import Plotly Module
import plotly.express as px

# Import Dataset
dataset = px.data.gapminder().query("continent=='Oceania'")

# Error Bars
plot = px.scatter(dataset, x="gdpPercap", y="lifeExp", color="country", error_x="pop", error_y="pop")

# Show the Plot
plot.show()
Output: