
Plotly Bubble Chart
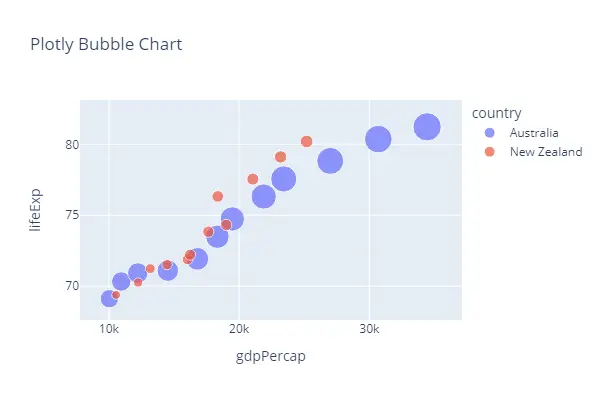
In this Plotly tutorial, you will learn how to plot a bubble chart in Python. The size parameter is used for the bubble chart in the following code. Free learning resources: AiHints, CodeAllow
In this Plotly tutorial, you will learn how to plot a bubble chart in Python. The size parameter is used for the bubble chart in the following code. Free learning resources: AiHints, CodeAllow
In this Plotly tutorial, you will learn how to plot a pie chart in Python. You can use px.pie() function to plot a pie chart. Output: Free learning resources: AiHints, CodeAllow
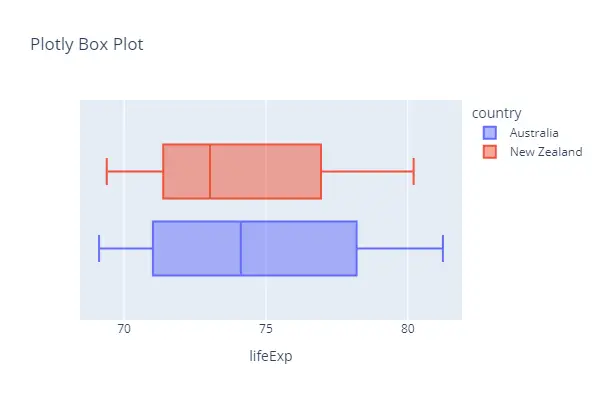
In this Plotly tutorial, you will learn how to plot a box plot in Python. You can use px.box() function to plot a box plot. Free learning resources: AiHints, CodeAllow
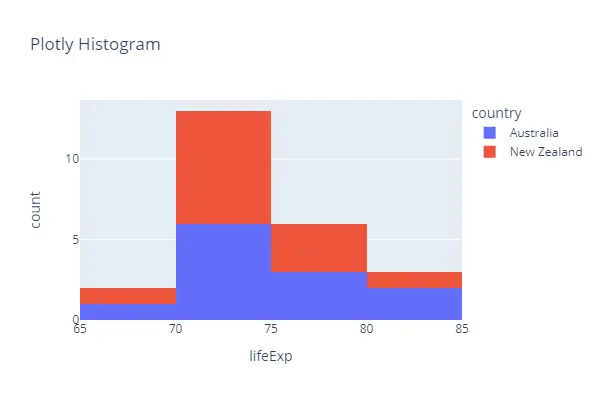
In this Plotly tutorial, you will learn how to plot a histogram in Python. You can use px.histogram() function to plot a histogram. Example 1 Output: Example 2 Output: Free learning resources: AiHints, CodeAllow
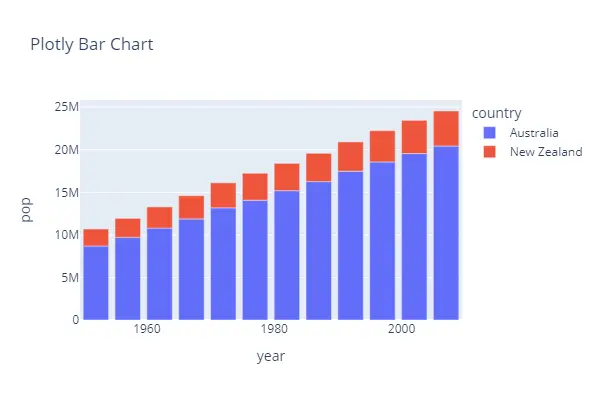
In this Plotly tutorial, you will learn how to plot a bar chart in Python. You can use px.bar() function to plot a bar chart. Example 1 Output: Example 2 Output: Free learning resources: AiHints, CodeAllow
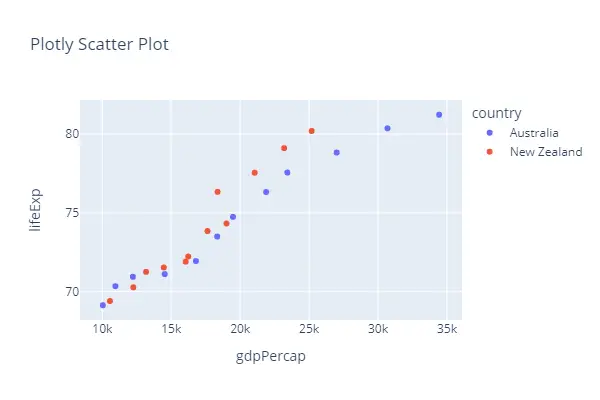
In this Plotly tutorial, you will learn how to plot a scatter plot in Python. You can use px.scatter() function to plot a scatter plot. Output: Free learning resources: AiHints, CodeAllow
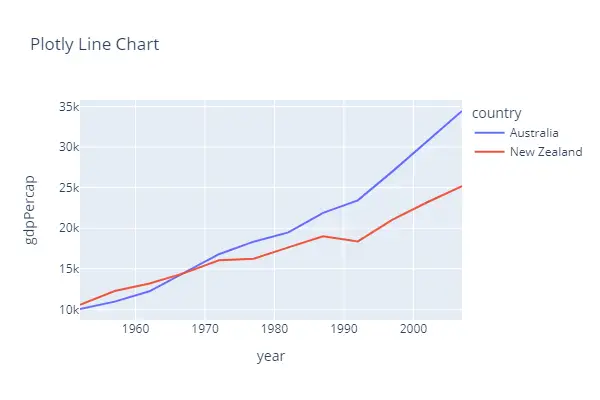
In this Plotly tutorial, you will learn how to plot a line chart or line graph in Python. You can use px.line() function to plot a line chart. Example 1 Output: Example 2 Output: Free learning resources: AiHints, CodeAllow
In this OpenCV Tutorial, you’ll learn how to capture video from a camera in OpenCV Python. If you want to capture video from your laptop camera then use this cv2.VideoCapture(0). I highly recommend you get the “Computer Vision: Models, Learning, and Inference Book” to learn computer vision.
In this OpenCV Tutorial, you’ll learn how to perform SIFT in OpenCV Python. SIFT is a short form of Scale Invariant Fourier Transform. This is a detector that is used for the detection of interest points in an image. I highly recommend you get the “Computer Vision: Models, Learning, and Inference Book” to learn computer vision. I …
In this OpenCV Tutorial, you’ll learn how to perform histogram equalization in OpenCV Python. Histogram equalization is used in image processing for contrast adjustment. I highly recommend you get the “Computer Vision: Models, Learning, and Inference Book” to learn computer vision. In the following example, I will use this image. Output: