
Plotly Nonlinear Regression
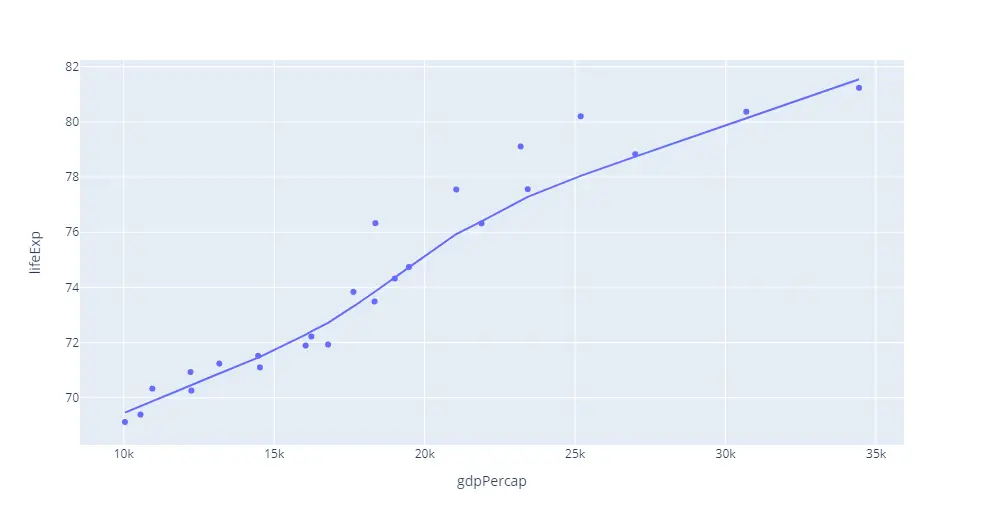
In this Plotly tutorial, you will learn how to plot nonlinear regression in Python. You have to use the parameter trendline=”lowess” for nonlinear regression. Output: Free learning resources: AiHints, CodeAllow
In this Plotly tutorial, you will learn how to plot nonlinear regression in Python. You have to use the parameter trendline=”lowess” for nonlinear regression. Output: Free learning resources: AiHints, CodeAllow